Estimated Value: $40,000 - $118,000
2
Beds
1
Bath
854
Sq Ft
$102/Sq Ft
Est. Value
About This Home
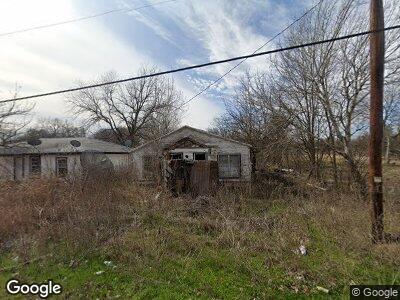
This home is located at 213 N Falls St, Mart, TX 76664 and is currently estimated at $87,344, approximately $102 per square foot. 213 N Falls St is a home located in McLennan County with nearby schools including Mart Elementary School and Mart High School.
Create a Home Valuation Report for This Property
The Home Valuation Report is an in-depth analysis detailing your home's value as well as a comparison with similar homes in the area
Home Values in the Area
Average Home Value in this Area
Tax History Compared to Growth
Tax History
| Year | Tax Paid | Tax Assessment Tax Assessment Total Assessment is a certain percentage of the fair market value that is determined by local assessors to be the total taxable value of land and additions on the property. | Land | Improvement |
|---|---|---|---|---|
| 2024 | $1,368 | $60,860 | $3,830 | $57,030 |
| 2023 | $1,387 | $60,820 | $3,830 | $56,990 |
| 2022 | $1,245 | $49,520 | $3,300 | $46,220 |
| 2021 | $929 | $33,480 | $3,000 | $30,480 |
| 2020 | $844 | $30,220 | $2,850 | $27,370 |
| 2019 | $869 | $30,330 | $2,780 | $27,550 |
| 2018 | $763 | $28,870 | $2,630 | $26,240 |
| 2017 | $691 | $26,160 | $2,550 | $23,610 |
| 2016 | $691 | $26,160 | $2,480 | $23,680 |
| 2015 | $675 | $25,530 | $2,400 | $23,130 |
| 2014 | $675 | $25,420 | $2,400 | $23,020 |
Source: Public Records
Map
Nearby Homes
- 313 N Elm St
- Parcel 7 Battle Lake Rd
- Parcel 5 Battle Lake Rd
- Parcel 4 Battle Lake Rd
- Parcel 3 Battle Lake Rd
- Parcel 2 Battle Lake Rd
- Parcel 1 Battle Lake Rd
- Parcel B Battle Lake Rd
- 387 E Burleson Ave
- 389 E Burleson Ave
- 385 E Burleson Ave
- 383 E Burleson Ave
- 498 Calvery Eskew Rd
- 108 S Criswell St
- 304 E Ross Ave
- 209 E Travis Ave
- 7668 Texas 164
- TBD E Texas Ave
- 211 S Smyth St
- 801 E Texas Ave