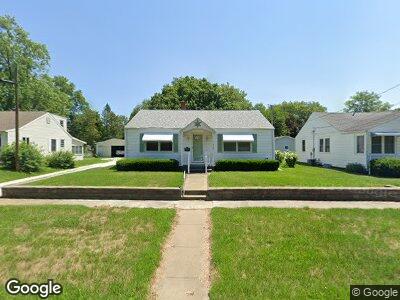
213 S 10th St Monmouth, IL 61462
Estimated Value: $76,000 - $116,000
2
Beds
1
Bath
1,152
Sq Ft
$85/Sq Ft
Est. Value
About This Home
This home is located at 213 S 10th St, Monmouth, IL 61462 and is currently estimated at $97,955, approximately $85 per square foot. 213 S 10th St is a home located in Warren County with nearby schools including Lincoln Early Childhood School, Central Intermediate School, and Harding Primary School.
Ownership History
Date
Name
Owned For
Owner Type
Purchase Details
Closed on
Sep 29, 2023
Sold by
Froelich Scott and Froelich Barbara
Bought by
Froelich Jessica D
Current Estimated Value
Home Financials for this Owner
Home Financials are based on the most recent Mortgage that was taken out on this home.
Original Mortgage
$79,200
Outstanding Balance
$74,851
Interest Rate
6.5%
Mortgage Type
New Conventional
Estimated Equity
$23,104
Purchase Details
Closed on
Sep 14, 2023
Sold by
Law Ricky Jo
Bought by
Froelich Scott and Froelich Barbara
Home Financials for this Owner
Home Financials are based on the most recent Mortgage that was taken out on this home.
Original Mortgage
$79,200
Outstanding Balance
$74,851
Interest Rate
6.5%
Mortgage Type
New Conventional
Estimated Equity
$23,104
Purchase Details
Closed on
Aug 21, 2023
Sold by
Law Ricky Jo
Bought by
Froelich Scott and Froelich Barbara
Home Financials for this Owner
Home Financials are based on the most recent Mortgage that was taken out on this home.
Original Mortgage
$79,200
Outstanding Balance
$74,851
Interest Rate
6.5%
Mortgage Type
New Conventional
Estimated Equity
$23,104
Create a Home Valuation Report for This Property
The Home Valuation Report is an in-depth analysis detailing your home's value as well as a comparison with similar homes in the area
Home Values in the Area
Average Home Value in this Area
Purchase History
| Date | Buyer | Sale Price | Title Company |
|---|---|---|---|
| Froelich Jessica D | $99,000 | None Listed On Document | |
| Froelich Scott | $99,000 | None Listed On Document |
Source: Public Records
Mortgage History
| Date | Status | Borrower | Loan Amount |
|---|---|---|---|
| Open | Froelich Jessica D | $79,200 | |
| Previous Owner | Law Ricky Jo | $12,000 |
Source: Public Records
Tax History Compared to Growth
Tax History
| Year | Tax Paid | Tax Assessment Tax Assessment Total Assessment is a certain percentage of the fair market value that is determined by local assessors to be the total taxable value of land and additions on the property. | Land | Improvement |
|---|---|---|---|---|
| 2023 | $851 | $24,770 | $1,460 | $23,310 |
| 2022 | $853 | $23,650 | $1,390 | $22,260 |
| 2021 | $848 | $22,180 | $1,310 | $20,870 |
| 2020 | $1,153 | $22,180 | $1,310 | $20,870 |
| 2019 | $849 | $21,610 | $1,280 | $20,330 |
| 2018 | $850 | $8,320 | $1,270 | $7,050 |
| 2017 | $837 | $21,260 | $1,260 | $20,000 |
| 2016 | $803 | $21,270 | $1,260 | $20,010 |
| 2015 | -- | $20,770 | $1,230 | $19,540 |
| 2014 | -- | $20,270 | $1,200 | $19,070 |
| 2013 | -- | $19,370 | $1,150 | $18,220 |
Source: Public Records
Map
Nearby Homes