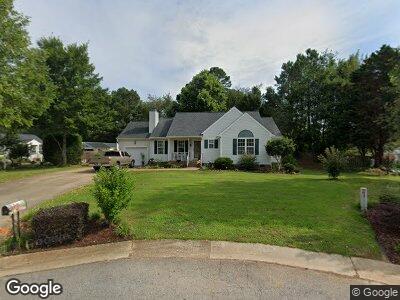
213 Spring Park Rd Wake Forest, NC 27587
Estimated Value: $308,000 - $347,000
3
Beds
2
Baths
1,310
Sq Ft
$253/Sq Ft
Est. Value
About This Home
This home is located at 213 Spring Park Rd, Wake Forest, NC 27587 and is currently estimated at $330,987, approximately $252 per square foot. 213 Spring Park Rd is a home located in Wake County with nearby schools including Forest Pines Drive Elementary School, Wake Forest-Rolesville Middle School, and Heritage High School.
Ownership History
Date
Name
Owned For
Owner Type
Purchase Details
Closed on
Apr 16, 2004
Sold by
Johnny Watson Builders Inc
Bought by
Mcgee Ii Jack and Mcgee Fara
Current Estimated Value
Home Financials for this Owner
Home Financials are based on the most recent Mortgage that was taken out on this home.
Original Mortgage
$132,914
Outstanding Balance
$64,873
Interest Rate
5.35%
Mortgage Type
FHA
Estimated Equity
$272,717
Purchase Details
Closed on
Sep 30, 2003
Sold by
Asencio Carlos J and Asencio Ina I
Bought by
Johnny Watson Builders Inc
Purchase Details
Closed on
Mar 31, 2000
Sold by
Ramco Development Inc
Bought by
Asencio Carlos J and Asencio Ina I
Home Financials for this Owner
Home Financials are based on the most recent Mortgage that was taken out on this home.
Original Mortgage
$133,750
Interest Rate
8.38%
Mortgage Type
VA
Create a Home Valuation Report for This Property
The Home Valuation Report is an in-depth analysis detailing your home's value as well as a comparison with similar homes in the area
Home Values in the Area
Average Home Value in this Area
Purchase History
| Date | Buyer | Sale Price | Title Company |
|---|---|---|---|
| Mcgee Ii Jack | $134,000 | None Available | |
| Johnny Watson Builders Inc | $121,000 | -- | |
| Asencio Carlos J | $130,000 | -- |
Source: Public Records
Mortgage History
| Date | Status | Borrower | Loan Amount |
|---|---|---|---|
| Open | Asencio Carlos J | $2,249 | |
| Closed | Mcgee Jack | $4,722 | |
| Closed | Mcgee Jack | $6,246 | |
| Open | Mcgee Ii Jack | $132,914 | |
| Previous Owner | Asencio Carlos J | $139,063 | |
| Previous Owner | Asencio Carlos J | $137,600 | |
| Previous Owner | Asencio Carlos J | $133,750 |
Source: Public Records
Tax History Compared to Growth
Tax History
| Year | Tax Paid | Tax Assessment Tax Assessment Total Assessment is a certain percentage of the fair market value that is determined by local assessors to be the total taxable value of land and additions on the property. | Land | Improvement |
|---|---|---|---|---|
| 2024 | $3,377 | $346,601 | $80,000 | $266,601 |
| 2023 | $2,400 | $204,822 | $45,000 | $159,822 |
| 2022 | $2,303 | $204,822 | $45,000 | $159,822 |
| 2021 | $2,263 | $204,822 | $45,000 | $159,822 |
| 2020 | $2,263 | $204,822 | $45,000 | $159,822 |
| 2019 | $1,896 | $151,186 | $28,000 | $123,186 |
| 2018 | $1,796 | $151,186 | $28,000 | $123,186 |
| 2017 | $1,736 | $151,186 | $28,000 | $123,186 |
| 2016 | $1,714 | $151,186 | $28,000 | $123,186 |
| 2015 | $1,756 | $153,004 | $30,000 | $123,004 |
| 2014 | $1,700 | $153,004 | $30,000 | $123,004 |
Source: Public Records
Map
Nearby Homes
- 1628 Highpoint St
- 1564 Highpoint St
- 416 Holding Creek Dr
- 413 Holding Creek Dr
- 1720 Highpoint St
- 1454 Cimarron Pkwy Unit 17
- 201 Broomgrove Way
- 203 Broomgrove Way
- 205 Broomgrove Way
- 513 Old Dairy Dr
- 1101 Breadsell Ln Unit 47
- 217 Broomgrove Way
- 1451 Cimarron Pkwy
- 561 Forestville Rd
- 561 Forestville Rd
- 561 Forestville Rd
- 515 Forestville Rd
- 513 Forestville Rd
- 521 Forestville Rd
- 519 Forestville Rd