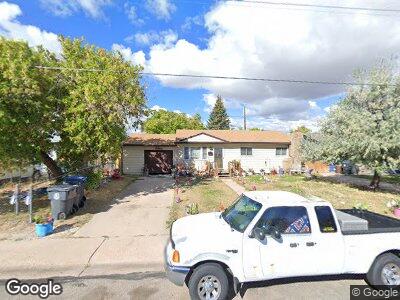
216 Stanfield Ave Cheyenne, WY 82007
Estimated Value: $217,000 - $287,343
--
Bed
--
Bath
900
Sq Ft
$285/Sq Ft
Est. Value
About This Home
This home is located at 216 Stanfield Ave, Cheyenne, WY 82007 and is currently estimated at $256,836, approximately $285 per square foot. 216 Stanfield Ave is a home located in Laramie County with nearby schools including Goins Elementary School, Johnson Junior High School, and South High School.
Ownership History
Date
Name
Owned For
Owner Type
Purchase Details
Closed on
May 2, 2007
Sold by
Wells Fargo Bank Na
Bought by
Baker Brian W
Current Estimated Value
Home Financials for this Owner
Home Financials are based on the most recent Mortgage that was taken out on this home.
Original Mortgage
$83,700
Interest Rate
8.37%
Mortgage Type
New Conventional
Purchase Details
Closed on
Dec 7, 2006
Sold by
Pierson Kimberly J and Pierson Mary K
Bought by
Wells Fargo Bank Na
Purchase Details
Closed on
Jul 17, 2006
Sold by
Pierson Kimberly J and Pierson Mary K
Bought by
Wells Fargo Bank Na
Purchase Details
Closed on
Dec 8, 2004
Sold by
Jacobs Robert G and Jacobs Robert C
Bought by
Pierson Kimberly J and Pierson Mary K
Home Financials for this Owner
Home Financials are based on the most recent Mortgage that was taken out on this home.
Original Mortgage
$108,000
Interest Rate
7.95%
Mortgage Type
Purchase Money Mortgage
Create a Home Valuation Report for This Property
The Home Valuation Report is an in-depth analysis detailing your home's value as well as a comparison with similar homes in the area
Home Values in the Area
Average Home Value in this Area
Purchase History
| Date | Buyer | Sale Price | Title Company |
|---|---|---|---|
| Baker Brian W | -- | None Available | |
| Wells Fargo Bank Na | $118,774 | None Available | |
| Wells Fargo Bank Na | $118,774 | None Available | |
| Pierson Kimberly J | -- | -- |
Source: Public Records
Mortgage History
| Date | Status | Borrower | Loan Amount |
|---|---|---|---|
| Open | Moody Andrew | $9,700 | |
| Open | Baker Brian W | $126,000 | |
| Closed | Baker Brian W | $83,700 | |
| Previous Owner | Pierson Kimberly J | $108,000 |
Source: Public Records
Tax History Compared to Growth
Tax History
| Year | Tax Paid | Tax Assessment Tax Assessment Total Assessment is a certain percentage of the fair market value that is determined by local assessors to be the total taxable value of land and additions on the property. | Land | Improvement |
|---|---|---|---|---|
| 2024 | $1,829 | $25,860 | $3,331 | $22,529 |
| 2023 | $1,767 | $24,996 | $3,331 | $21,665 |
| 2022 | $1,624 | $22,501 | $3,331 | $19,170 |
| 2021 | $1,391 | $19,224 | $3,331 | $15,893 |
| 2020 | $1,271 | $17,613 | $3,331 | $14,282 |
| 2019 | $1,252 | $17,345 | $3,331 | $14,014 |
| 2018 | $1,053 | $14,730 | $2,497 | $12,233 |
| 2017 | $1,009 | $13,987 | $2,497 | $11,490 |
| 2016 | $949 | $13,141 | $2,435 | $10,706 |
| 2015 | $906 | $12,548 | $2,435 | $10,113 |
| 2014 | $893 | $12,288 | $2,435 | $9,853 |
Source: Public Records
Map
Nearby Homes
- 237 Bent Ave
- 242 Bent Ave
- 1119 W Jefferson Rd
- 243 Snyder Ave
- 303 Chris Loop
- TBD Arkel Way
- TBD Snyder Ave
- TBD Stanfield Ave
- 511 W 6th St
- 517 W 6th St
- 1106 Melody Ln
- 326 Cribbon Ave
- TBD Deming Dr
- 1131 Concerto Ln
- 1206 Concerto Ln
- TBD Jefferson Rd
- 347 Mccomb Ave
- 1538 W Leisher Rd
- 121 Ahrens Ave
- 1213 Sonata Ln