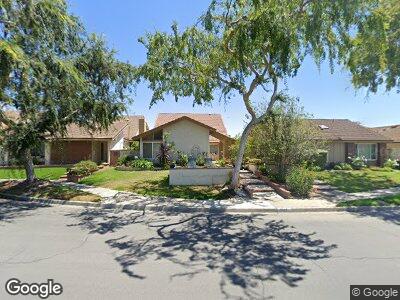
2161 Sweetbriar Rd Tustin, CA 92780
Estimated Value: $1,125,286 - $1,289,000
4
Beds
3
Baths
1,801
Sq Ft
$655/Sq Ft
Est. Value
About This Home
This home is located at 2161 Sweetbriar Rd, Tustin, CA 92780 and is currently estimated at $1,180,072, approximately $655 per square foot. 2161 Sweetbriar Rd is a home located in Orange County with nearby schools including W. R. Nelson Elementary School, C. E. Utt Middle School, and Tustin High School.
Ownership History
Date
Name
Owned For
Owner Type
Purchase Details
Closed on
Sep 30, 2009
Sold by
Nguyen Minh and Dinh Thu Minh
Bought by
Galang Ernesto B and Galang Cynthia D
Current Estimated Value
Home Financials for this Owner
Home Financials are based on the most recent Mortgage that was taken out on this home.
Original Mortgage
$417,000
Interest Rate
5%
Mortgage Type
New Conventional
Purchase Details
Closed on
Aug 30, 2006
Sold by
Nguyen Minh and Dinh Thu Minh
Bought by
Nguyen Minh and Dinh Thu Minh
Purchase Details
Closed on
Jun 22, 1994
Sold by
Anthony Jack Holland
Bought by
Nguyen Minh and Dinh Thu Minh
Home Financials for this Owner
Home Financials are based on the most recent Mortgage that was taken out on this home.
Original Mortgage
$158,400
Interest Rate
8.38%
Create a Home Valuation Report for This Property
The Home Valuation Report is an in-depth analysis detailing your home's value as well as a comparison with similar homes in the area
Home Values in the Area
Average Home Value in this Area
Purchase History
| Date | Buyer | Sale Price | Title Company |
|---|---|---|---|
| Galang Ernesto B | $474,000 | Landwood Title | |
| Nguyen Minh | -- | None Available | |
| Nguyen Minh | $198,000 | Orange Coast Title |
Source: Public Records
Mortgage History
| Date | Status | Borrower | Loan Amount |
|---|---|---|---|
| Open | Galang Ernesto B | $398,000 | |
| Closed | Galang Ernesto B | $417,000 | |
| Previous Owner | Nguyen Minh | $154,400 | |
| Previous Owner | Nguyen Minh | $158,400 |
Source: Public Records
Tax History Compared to Growth
Tax History
| Year | Tax Paid | Tax Assessment Tax Assessment Total Assessment is a certain percentage of the fair market value that is determined by local assessors to be the total taxable value of land and additions on the property. | Land | Improvement |
|---|---|---|---|---|
| 2024 | $6,420 | $599,341 | $475,913 | $123,428 |
| 2023 | $6,278 | $587,590 | $466,582 | $121,008 |
| 2022 | $6,178 | $576,069 | $457,433 | $118,636 |
| 2021 | $6,048 | $564,774 | $448,464 | $116,310 |
| 2020 | $6,017 | $558,983 | $443,865 | $115,118 |
| 2019 | $5,859 | $548,023 | $435,162 | $112,861 |
| 2018 | $5,759 | $537,278 | $426,629 | $110,649 |
| 2017 | $5,654 | $526,744 | $418,264 | $108,480 |
| 2016 | $5,549 | $516,416 | $410,063 | $106,353 |
| 2015 | $5,502 | $508,659 | $403,903 | $104,756 |
| 2014 | $5,353 | $498,696 | $395,992 | $102,704 |
Source: Public Records
Map
Nearby Homes
- 14411 Cherrywood Ln
- 164 Seville
- 111 Madrid
- 2325 Dahlia Dr
- 104 Malaga Unit 104
- 101 Malaga St Unit 101
- 1881 Mitchell Ave Unit 117
- 1881 Mitchell Ave Unit 5
- 1777 Mitchell Ave Unit 51
- 1608 Mitchell Ave
- 2221 Apple Tree Dr
- 13791 Browning Ave Unit 7
- 13744 Comanche
- 14761 Branbury Place
- 2196 Evergreen Dr
- 13635 Almond St Unit 224
- 1691 Green Meadow Ave
- 1671 Green Meadow Ave
- 14882 Bridgeport Rd
- 15205 Severyns Rd