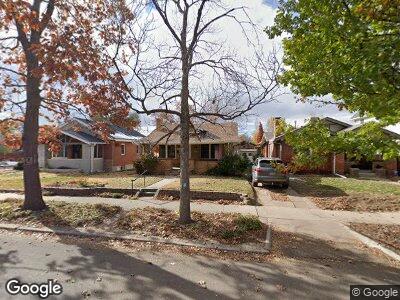
2187 S Emerson St Denver, CO 80210
Rosedale NeighborhoodEstimated Value: $630,000 - $774,000
3
Beds
1
Bath
934
Sq Ft
$734/Sq Ft
Est. Value
About This Home
This home is located at 2187 S Emerson St, Denver, CO 80210 and is currently estimated at $685,816, approximately $734 per square foot. 2187 S Emerson St is a home located in Denver County with nearby schools including Asbury Elementary School, Grant Beacon Middle School, and South High School.
Ownership History
Date
Name
Owned For
Owner Type
Purchase Details
Closed on
Nov 19, 2015
Sold by
Swierenga Patricia J
Bought by
Wiegers Georgia R and Swierenga Kenneth J
Current Estimated Value
Purchase Details
Closed on
Aug 19, 2015
Sold by
Swierenga Lillian Ruth and Swierenga Patricia J
Bought by
Swierenga Patricia J
Home Financials for this Owner
Home Financials are based on the most recent Mortgage that was taken out on this home.
Original Mortgage
$215,000
Interest Rate
4.03%
Mortgage Type
New Conventional
Purchase Details
Closed on
Mar 17, 2006
Sold by
Swierenga Lillian Ruth
Bought by
Swierenga Lillian Ruth and Swierenga Patricia J
Home Financials for this Owner
Home Financials are based on the most recent Mortgage that was taken out on this home.
Original Mortgage
$28,000
Interest Rate
6.33%
Mortgage Type
Unknown
Create a Home Valuation Report for This Property
The Home Valuation Report is an in-depth analysis detailing your home's value as well as a comparison with similar homes in the area
Home Values in the Area
Average Home Value in this Area
Purchase History
| Date | Buyer | Sale Price | Title Company |
|---|---|---|---|
| Swierenga Patricia J | -- | None Available | |
| Swierenga Lillian Ruth | -- | None Available |
Source: Public Records
Mortgage History
| Date | Status | Borrower | Loan Amount |
|---|---|---|---|
| Closed | Swierenga Patricia J | $244,500 | |
| Closed | Swierenga Patricia J | $215,000 | |
| Closed | Swierenga Patricia J | $28,000 | |
| Closed | Swierenga Lillian R | $10,000 |
Source: Public Records
Tax History Compared to Growth
Tax History
| Year | Tax Paid | Tax Assessment Tax Assessment Total Assessment is a certain percentage of the fair market value that is determined by local assessors to be the total taxable value of land and additions on the property. | Land | Improvement |
|---|---|---|---|---|
| 2024 | $2,906 | $43,390 | $19,340 | $24,050 |
| 2023 | $2,843 | $43,390 | $19,340 | $24,050 |
| 2022 | $2,370 | $36,750 | $23,030 | $13,720 |
| 2021 | $2,288 | $37,810 | $23,700 | $14,110 |
| 2020 | $2,087 | $35,280 | $21,940 | $13,340 |
| 2019 | $2,029 | $35,280 | $21,940 | $13,340 |
| 2018 | $1,443 | $25,850 | $15,020 | $10,830 |
| 2017 | $1,994 | $25,850 | $15,020 | $10,830 |
| 2016 | $1,951 | $23,920 | $15,633 | $8,287 |
| 2015 | $1,247 | $23,920 | $15,633 | $8,287 |
| 2014 | $1,081 | $20,970 | $11,725 | $9,245 |
Source: Public Records
Map
Nearby Homes
- 2120 S Clarkson St
- 2182 S Ogden St
- 2125 S Ogden St
- 2143 S Downing St
- 2056 S Ogden St
- 2033 S Ogden St
- 2039 S Corona St
- 2050 S Corona St
- 2370 S Ogden St
- 1968 S Washington St
- 2117 S Lafayette St
- 2630-2636 S Marion St
- 2101 S Lafayette St Unit 2103
- 2103 S Lafayette St
- 1958 S Pearl St
- 1928 S Washington St
- 2434 S Ogden St Unit 2434-2436
- 2101+2103 S Lafayette St
- 2203 S Humboldt St
- 2050 S Lafayette St