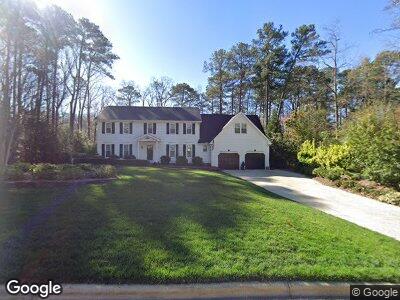
219 Ronaldsby Dr Cary, NC 27511
South Cary NeighborhoodEstimated Value: $1,071,000 - $1,352,000
5
Beds
5
Baths
5,242
Sq Ft
$226/Sq Ft
Est. Value
About This Home
This home is located at 219 Ronaldsby Dr, Cary, NC 27511 and is currently estimated at $1,183,243, approximately $225 per square foot. 219 Ronaldsby Dr is a home located in Wake County with nearby schools including Briarcliff Elementary School, East Cary Middle School, and Cary High School.
Ownership History
Date
Name
Owned For
Owner Type
Purchase Details
Closed on
Nov 8, 2013
Sold by
Layne Julie Scott and Layne Julia S
Bought by
Layne Joseph Carl
Current Estimated Value
Home Financials for this Owner
Home Financials are based on the most recent Mortgage that was taken out on this home.
Original Mortgage
$200,000
Interest Rate
4.23%
Mortgage Type
New Conventional
Purchase Details
Closed on
Jul 21, 2009
Sold by
Estate Of Mary Ann Bake and Miller Barbara Ann
Bought by
Layne Joseph and Layne Julie S
Home Financials for this Owner
Home Financials are based on the most recent Mortgage that was taken out on this home.
Original Mortgage
$224,000
Interest Rate
5.53%
Mortgage Type
New Conventional
Purchase Details
Closed on
Jun 25, 2002
Sold by
Miller Barbara Ann and Bake Mary Ann
Bought by
Miller Barbara Ann
Purchase Details
Closed on
Aug 29, 2000
Sold by
Bake Earl Allan
Bought by
Bake Earl Allan and Bake Mary Ann
Create a Home Valuation Report for This Property
The Home Valuation Report is an in-depth analysis detailing your home's value as well as a comparison with similar homes in the area
Home Values in the Area
Average Home Value in this Area
Purchase History
| Date | Buyer | Sale Price | Title Company |
|---|---|---|---|
| Layne Joseph Carl | -- | None Available | |
| Layne Joseph | $280,000 | None Available | |
| Miller Barbara Ann | -- | -- | |
| Bake Earl Allan | -- | -- |
Source: Public Records
Mortgage History
| Date | Status | Borrower | Loan Amount |
|---|---|---|---|
| Open | Layne Joseph Carl | $50,000 | |
| Open | Layne Joseph Carl | $113,000 | |
| Open | Layne Joseph Carl | $196,000 | |
| Closed | Layne Joseph Carl | $200,000 | |
| Closed | Layne Joseph Carl | $185,000 | |
| Closed | Layne Joseph Carl | $216,270 | |
| Closed | Layne Joseph Carl | $223,800 | |
| Previous Owner | Layne Joseph | $224,000 | |
| Previous Owner | Bake Mary Ann | $130,000 |
Source: Public Records
Tax History Compared to Growth
Tax History
| Year | Tax Paid | Tax Assessment Tax Assessment Total Assessment is a certain percentage of the fair market value that is determined by local assessors to be the total taxable value of land and additions on the property. | Land | Improvement |
|---|---|---|---|---|
| 2024 | $7,656 | $910,730 | $320,000 | $590,730 |
| 2023 | $6,072 | $603,956 | $200,000 | $403,956 |
| 2022 | $5,845 | $603,956 | $200,000 | $403,956 |
| 2021 | $5,727 | $603,956 | $200,000 | $403,956 |
| 2020 | $5,758 | $603,956 | $200,000 | $403,956 |
| 2019 | $5,146 | $478,736 | $160,000 | $318,736 |
| 2018 | $4,828 | $478,736 | $160,000 | $318,736 |
| 2017 | $4,640 | $478,736 | $160,000 | $318,736 |
| 2016 | $4,570 | $478,736 | $160,000 | $318,736 |
| 2015 | $4,212 | $425,757 | $180,000 | $245,757 |
| 2014 | $3,971 | $393,213 | $180,000 | $213,213 |
Source: Public Records
Map
Nearby Homes
- 505 Annandale Dr
- 212 Ronaldsby Dr
- 222 Kelso Ct
- 104 Perth Ct
- 408 Evert Dr
- 131 Long Shadow Ln
- 106 Springbrook Place
- 134 Castlewood Dr
- 118 Duncansby Ct
- 312 Troon Village Ln Unit 11A
- 501 Queensferry Rd
- 302 Edinburgh Dr
- 103 Bruce Dr
- 102 Windrock Ln
- 509 Queensferry Rd
- 2004 Clyde Bank Ct Unit 27A
- 108 Ridgepath Way
- 1013 Thistle Briar Place
- 224 Heidinger Dr
- 2002 Clyde Bank Ct Unit 27B