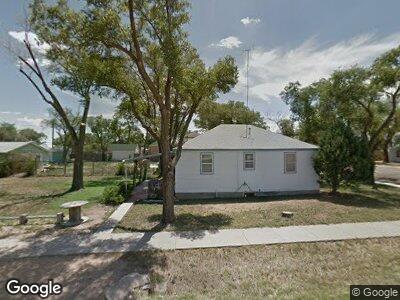
219 Washington Ave Sugar City, CO 81076
Estimated Value: $68,251 - $170,000
3
Beds
3
Baths
1,310
Sq Ft
$98/Sq Ft
Est. Value
About This Home
This home is located at 219 Washington Ave, Sugar City, CO 81076 and is currently estimated at $128,813, approximately $98 per square foot. 219 Washington Ave is a home located in Crowley County with nearby schools including Crowley County Ward Intermediate and Crowley County Junior & Senior High School.
Ownership History
Date
Name
Owned For
Owner Type
Purchase Details
Closed on
Sep 26, 2016
Sold by
The Phoebe Ann Mueller Trust
Bought by
Bell Gregory J
Current Estimated Value
Purchase Details
Closed on
Feb 16, 2007
Sold by
The Phoebe Ann Mueller Trust
Bought by
Statement Of Authority
Purchase Details
Closed on
Feb 15, 2007
Sold by
Community Banks Of Southern Colorado
Bought by
The Phoebe Ann Mueller Trust
Purchase Details
Closed on
Nov 8, 2005
Sold by
Erickson Brant--Pt Deed
Bought by
Community Banks Of Southern Colorado
Purchase Details
Closed on
Sep 12, 2005
Sold by
Erickson Brant--Pt Cert Of Purchase
Bought by
Community Banks Of Southern Colorado
Purchase Details
Closed on
Jun 20, 2005
Sold by
Erickson Brant--Notice Of Demand & Sale
Bought by
Community Banks Of Southern Colorado
Purchase Details
Closed on
Jun 7, 2005
Sold by
Erickson Brant
Bought by
Withdrdawl Of Election & Demand For Sale
Create a Home Valuation Report for This Property
The Home Valuation Report is an in-depth analysis detailing your home's value as well as a comparison with similar homes in the area
Home Values in the Area
Average Home Value in this Area
Purchase History
| Date | Buyer | Sale Price | Title Company |
|---|---|---|---|
| Bell Gregory J | $48,000 | -- | |
| Statement Of Authority | -- | -- | |
| The Phoebe Ann Mueller Trust | $25,000 | -- | |
| Statement Of Authority | -- | -- | |
| Community Banks Of Southern Colorado | -- | -- | |
| Community Banks Of Southern Colorado | -- | -- | |
| Community Banks Of Southern Colorado | -- | -- | |
| Withdrdawl Of Election & Demand For Sale | -- | -- |
Source: Public Records
Tax History Compared to Growth
Tax History
| Year | Tax Paid | Tax Assessment Tax Assessment Total Assessment is a certain percentage of the fair market value that is determined by local assessors to be the total taxable value of land and additions on the property. | Land | Improvement |
|---|---|---|---|---|
| 2024 | $340 | $1,000 | $44 | $956 |
| 2023 | $340 | $1,000 | $44 | $956 |
| 2022 | $362 | $4,216 | $209 | $4,007 |
| 2021 | $360 | $4,337 | $215 | $4,122 |
| 2020 | $349 | $4,337 | $215 | $4,122 |
| 2019 | $371 | $4,337 | $215 | $4,122 |
| 2018 | $280 | $3,159 | $216 | $2,943 |
| 2017 | $274 | $3,159 | $216 | $2,943 |
| 2016 | $275 | $3,490 | $240 | $3,250 |
| 2015 | $284 | $3,490 | $240 | $3,250 |
| 2014 | $284 | $3,490 | $240 | $3,250 |
| 2013 | $281 | $3,490 | $240 | $3,250 |
| 2012 | $284 | $3,490 | $240 | $3,250 |
Source: Public Records
Map
Nearby Homes
- 223 Nebraska St
- 410 Iowa St
- 20164 Sherman Ln
- 8618 Maverick Ln
- 7943 Maverick Ln
- 19469 County Road H
- 18055 County Road G
- 213 Center Ave
- 217 Center Ave
- 318 E 3rd St
- 830 Sherman Ave Unit 8
- 204 E 3rd St
- 322 Main St
- 119 W 5th St
- 113 W 5th St
- 524 Arkansas Ave
- 304 Arkansas Ave
- 316 Arkansas Ave
- 123 Arkansas Ave
- 413 Mitchell Ave