Estimated Value: $743,608 - $872,000
5
Beds
3
Baths
2,897
Sq Ft
$272/Sq Ft
Est. Value
About This Home
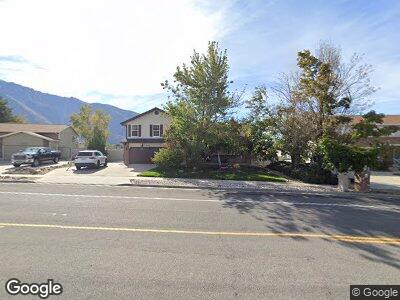
This home is located at 2202 E Sego Lily Dr, Sandy, UT 84092 and is currently estimated at $788,652, approximately $272 per square foot. 2202 E Sego Lily Dr is a home located in Salt Lake County with nearby schools including Park Lane Elementary School, Eastmont Middle School, and Jordan High.
Ownership History
Date
Name
Owned For
Owner Type
Purchase Details
Closed on
Mar 12, 2008
Sold by
Mcqueen Ryan W
Bought by
Mcqueen Ryan W and Mcqueen Edyta
Current Estimated Value
Home Financials for this Owner
Home Financials are based on the most recent Mortgage that was taken out on this home.
Original Mortgage
$277,600
Interest Rate
5.65%
Mortgage Type
Stand Alone Refi Refinance Of Original Loan
Purchase Details
Closed on
Apr 25, 2002
Sold by
Cox Larry
Bought by
Cox Judy
Purchase Details
Closed on
Apr 9, 1999
Sold by
Cox Larry
Bought by
Cox Judy M
Home Financials for this Owner
Home Financials are based on the most recent Mortgage that was taken out on this home.
Original Mortgage
$168,500
Interest Rate
7.04%
Purchase Details
Closed on
Apr 8, 1999
Sold by
Vanvancox Larry Van and Cox Judy M
Bought by
Cox Larry
Home Financials for this Owner
Home Financials are based on the most recent Mortgage that was taken out on this home.
Original Mortgage
$168,500
Interest Rate
7.04%
Create a Home Valuation Report for This Property
The Home Valuation Report is an in-depth analysis detailing your home's value as well as a comparison with similar homes in the area
Home Values in the Area
Average Home Value in this Area
Purchase History
| Date | Buyer | Sale Price | Title Company |
|---|---|---|---|
| Mcqueen Ryan W | -- | First American Title | |
| Mcqueen Ryan W | -- | First American Title | |
| Cox Judy | -- | -- | |
| Cox Judy M | -- | -- | |
| Cox Larry | -- | -- |
Source: Public Records
Mortgage History
| Date | Status | Borrower | Loan Amount |
|---|---|---|---|
| Open | Mcqueen Ryan W | $90,000 | |
| Open | Mcqueen Ryan W | $256,500 | |
| Closed | Mcqueen Ryan W | $273,000 | |
| Closed | Mcqueen Ryan W | $277,600 | |
| Previous Owner | Cox Judy | $180,000 | |
| Previous Owner | Cox Larry | $168,500 |
Source: Public Records
Tax History Compared to Growth
Tax History
| Year | Tax Paid | Tax Assessment Tax Assessment Total Assessment is a certain percentage of the fair market value that is determined by local assessors to be the total taxable value of land and additions on the property. | Land | Improvement |
|---|---|---|---|---|
| 2023 | $3,441 | $627,400 | $283,300 | $344,100 |
| 2022 | $3,235 | $576,300 | $277,800 | $298,500 |
| 2021 | $2,864 | $433,800 | $222,200 | $211,600 |
| 2020 | $2,736 | $390,500 | $222,200 | $168,300 |
| 2019 | $2,667 | $370,900 | $212,400 | $158,500 |
| 2018 | $2,318 | $335,300 | $212,400 | $122,900 |
| 2017 | $2,242 | $309,600 | $212,400 | $97,200 |
| 2016 | $2,153 | $287,100 | $191,400 | $95,700 |
| 2015 | $2,307 | $284,800 | $202,900 | $81,900 |
| 2014 | $2,226 | $269,300 | $197,100 | $72,200 |
Source: Public Records
Map
Nearby Homes
- 2266 Karalee Way
- 2054 Glacier View Dr
- 2113 Dimple Dell Rd
- 2004 E Sego Lily Dr
- 2266 E 10095 S
- 10665 S 2340 E
- 2076 E 10095 S
- 10063 S Kalinda Dr
- 10299 S 2505 E
- 2476 Dimple Dell Rd
- 2050 E Gyrfalcon Dr
- 10128 S 2460 E
- 2067 E Gyrfalcon Ln
- 10268 S Loridan Ln
- 1994 E Gyrfalcon Dr
- 10119 Sunderland Cir
- 2026 E 10765 S
- 2118 E Kramer Dr
- 2002 E Pepper View Cir
- 16 Gatehouse Ln