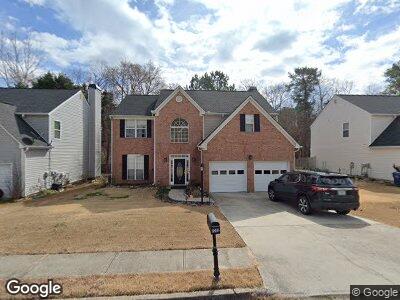
2202 Fall Creek Lodge Loganville, GA 30052
Estimated Value: $336,155 - $366,000
3
Beds
3
Baths
2,176
Sq Ft
$163/Sq Ft
Est. Value
About This Home
This home is located at 2202 Fall Creek Lodge, Loganville, GA 30052 and is currently estimated at $354,039, approximately $162 per square foot. 2202 Fall Creek Lodge is a home located in Gwinnett County with nearby schools including Rosebud Elementary School, Grace Snell Middle School, and South Gwinnett High School.
Ownership History
Date
Name
Owned For
Owner Type
Purchase Details
Closed on
Dec 11, 2015
Sold by
Opis Realty Llc
Bought by
Edwards Eda
Current Estimated Value
Home Financials for this Owner
Home Financials are based on the most recent Mortgage that was taken out on this home.
Original Mortgage
$152,192
Outstanding Balance
$125,669
Interest Rate
4.37%
Mortgage Type
FHA
Estimated Equity
$228,370
Purchase Details
Closed on
May 18, 2015
Sold by
Bayview Loan Servicing Llc
Bought by
Opis Realty Llc
Purchase Details
Closed on
Apr 1, 2014
Sold by
Fuccillo John J
Bought by
Bayview Loan Servicing Llc
Purchase Details
Closed on
Nov 28, 2000
Sold by
Fuccillio John J
Bought by
Fuccillio John J and Fuccillio Krystna
Home Financials for this Owner
Home Financials are based on the most recent Mortgage that was taken out on this home.
Original Mortgage
$152,487
Interest Rate
7.82%
Mortgage Type
FHA
Create a Home Valuation Report for This Property
The Home Valuation Report is an in-depth analysis detailing your home's value as well as a comparison with similar homes in the area
Home Values in the Area
Average Home Value in this Area
Purchase History
| Date | Buyer | Sale Price | Title Company |
|---|---|---|---|
| Edwards Eda | $155,000 | -- | |
| Opis Realty Llc | $105,000 | -- | |
| Bayview Loan Servicing Llc | $144,000 | -- | |
| Fuccillio John J | -- | -- | |
| Fuccillo John J | $154,500 | -- |
Source: Public Records
Mortgage History
| Date | Status | Borrower | Loan Amount |
|---|---|---|---|
| Open | Edwards Eda | $152,192 | |
| Previous Owner | Fuccillo John J | $152,487 |
Source: Public Records
Tax History Compared to Growth
Tax History
| Year | Tax Paid | Tax Assessment Tax Assessment Total Assessment is a certain percentage of the fair market value that is determined by local assessors to be the total taxable value of land and additions on the property. | Land | Improvement |
|---|---|---|---|---|
| 2023 | $5,100 | $126,960 | $29,680 | $97,280 |
| 2022 | $4,154 | $107,960 | $22,000 | $85,960 |
| 2021 | $3,429 | $86,360 | $16,000 | $70,360 |
| 2020 | $3,250 | $80,920 | $16,000 | $64,920 |
| 2019 | $2,819 | $71,960 | $12,000 | $59,960 |
| 2018 | $2,689 | $68,280 | $12,000 | $56,280 |
| 2016 | $2,422 | $60,160 | $8,800 | $51,360 |
| 2015 | $1,796 | $48,240 | $8,800 | $39,440 |
| 2014 | -- | $44,000 | $8,800 | $35,200 |
Source: Public Records
Map
Nearby Homes
- 2162 Fall Creek Lodge
- 2162 Fall Creek Landing
- 3967 Moos Creek Ct
- 2311 Fall Creek Landing
- 4171 Dean Grove Way
- 4161 Dean Grove Way
- 4028 Elm Trace Dr
- 2373 Shady Maple Ln
- 2283 Shady Maple Ln
- 2397 Shady Maple Trail
- 2277 Shady Maple Trail
- 2055 Winnstead Place
- 2060 Pate Ridge Dr Unit 1
- 4001 Oak Field Dr
- 3889 Elm Trace Dr
- 3876 Elm Trace Ct
- 1965 Winnstead Place