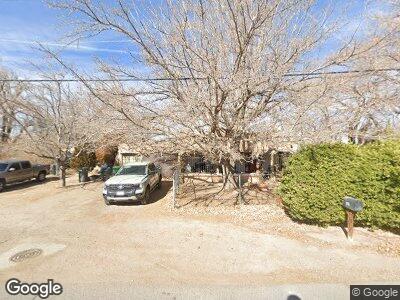
221 Rossmoor Ave SW Albuquerque, NM 87105
Estimated Value: $290,000 - $406,000
2
Beds
1
Bath
2,034
Sq Ft
$162/Sq Ft
Est. Value
About This Home
This home is located at 221 Rossmoor Ave SW, Albuquerque, NM 87105 and is currently estimated at $330,202, approximately $162 per square foot. 221 Rossmoor Ave SW is a home located in Bernalillo County with nearby schools including Mountain View Elementary School, Polk Middle School, and Rio Grande High School.
Create a Home Valuation Report for This Property
The Home Valuation Report is an in-depth analysis detailing your home's value as well as a comparison with similar homes in the area
Home Values in the Area
Average Home Value in this Area
Mortgage History
| Date | Status | Borrower | Loan Amount |
|---|---|---|---|
| Closed | Hunter John Dale | $292,500 |
Source: Public Records
Tax History Compared to Growth
Tax History
| Year | Tax Paid | Tax Assessment Tax Assessment Total Assessment is a certain percentage of the fair market value that is determined by local assessors to be the total taxable value of land and additions on the property. | Land | Improvement |
|---|---|---|---|---|
| 2024 | -- | $56,367 | $23,049 | $33,318 |
| 2023 | $0 | $54,726 | $22,378 | $32,348 |
| 2022 | $0 | $53,132 | $21,726 | $31,406 |
| 2021 | $1,647 | $51,585 | $21,094 | $30,491 |
| 2020 | $1,647 | $50,082 | $20,479 | $29,603 |
| 2019 | $1,709 | $48,624 | $19,883 | $28,741 |
| 2018 | $1,647 | $48,624 | $19,883 | $28,741 |
| 2017 | $1,584 | $47,209 | $19,304 | $27,905 |
| 2016 | $1,523 | $44,500 | $18,197 | $26,303 |
| 2015 | $43,204 | $43,204 | $17,667 | $25,537 |
| 2014 | $2,164 | $41,946 | $17,152 | $24,794 |
| 2013 | -- | $40,725 | $16,653 | $24,072 |
Source: Public Records
Map
Nearby Homes
- 1410 Jackson Rd SW
- 14 Paradise Road Lots 1 2 3
- 1630 Bonaguidi Rd SW
- 1615 Saunders Rd SW
- 2234 Perry Rd SW
- 1320 Rinconado Ln SW
- 3740 Isleta Blvd SW
- 3742 Isleta Blvd SW
- 505 Valplano Rd SE
- 1723 Valley Rd SW
- 1319 La Vega Dr SW
- 2700 Viola Rd SW
- 3820 Beall Ct SW
- 1415 Mora Rd SW
- 4025 Isleta Blvd SW
- 1215 La Vega Dr SW
- 1901 Isleta Blvd SW
- 1718 Evergreen Dr SW
- 2912 William St SE
- 1204 Lopez Rd SW