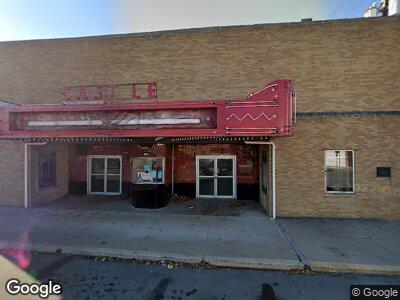
221 S Main St New Castle, IN 47362
Estimated Value: $209,561
--
Bed
--
Bath
9,412
Sq Ft
$22/Sq Ft
Est. Value
About This Home
This home is located at 221 S Main St, New Castle, IN 47362 and is currently estimated at $209,561, approximately $22 per square foot. 221 S Main St is a home located in Henry County with nearby schools including Agape Learning Center.
Ownership History
Date
Name
Owned For
Owner Type
Purchase Details
Closed on
May 6, 2021
Sold by
Alafogianis Othiseas
Bought by
Delc Holdings Llc
Current Estimated Value
Purchase Details
Closed on
Jan 26, 2021
Sold by
Sky Vue Llc
Bought by
Cook Cory and Cook Dan
Home Financials for this Owner
Home Financials are based on the most recent Mortgage that was taken out on this home.
Original Mortgage
$70,000
Interest Rate
2.7%
Mortgage Type
New Conventional
Purchase Details
Closed on
Dec 11, 2020
Sold by
Sky Vue Llc
Bought by
Alafogianis Othiseas
Home Financials for this Owner
Home Financials are based on the most recent Mortgage that was taken out on this home.
Original Mortgage
$70,000
Interest Rate
2.7%
Mortgage Type
New Conventional
Purchase Details
Closed on
Oct 7, 2020
Sold by
Jpmorgan Chase Bank Na
Bought by
Sky Vue Llc
Create a Home Valuation Report for This Property
The Home Valuation Report is an in-depth analysis detailing your home's value as well as a comparison with similar homes in the area
Home Values in the Area
Average Home Value in this Area
Purchase History
| Date | Buyer | Sale Price | Title Company |
|---|---|---|---|
| Delc Holdings Llc | -- | None Available | |
| Cook Cory | -- | None Available | |
| Alafogianis Othiseas | -- | None Available | |
| Sky Vue Llc | -- | None Available |
Source: Public Records
Mortgage History
| Date | Status | Borrower | Loan Amount |
|---|---|---|---|
| Previous Owner | Alafogianis Othiseas | $70,000 |
Source: Public Records
Tax History Compared to Growth
Tax History
| Year | Tax Paid | Tax Assessment Tax Assessment Total Assessment is a certain percentage of the fair market value that is determined by local assessors to be the total taxable value of land and additions on the property. | Land | Improvement |
|---|---|---|---|---|
| 2024 | $918 | $30,600 | $17,000 | $13,600 |
| 2023 | $918 | $30,600 | $17,000 | $13,600 |
| 2022 | $927 | $30,900 | $17,000 | $13,900 |
| 2021 | $912 | $30,400 | $17,000 | $13,400 |
| 2020 | $5,492 | $180,100 | $54,800 | $125,300 |
| 2019 | $5,494 | $180,100 | $54,800 | $125,300 |
| 2018 | $10,364 | $340,700 | $54,800 | $285,900 |
| 2017 | $4,343 | $142,000 | $23,400 | $118,600 |
| 2016 | $4,323 | $142,000 | $23,400 | $118,600 |
| 2014 | $4,194 | $139,800 | $23,400 | $116,400 |
| 2013 | $4,194 | $134,400 | $23,400 | $111,000 |
Source: Public Records
Map
Nearby Homes
- 400 S 14 St
- 425 S Main St
- 400 S 14th St
- 402 S 15th St
- 227 N 14th St
- 519 S 11th St
- 311 Ninth St N
- 616 S Main St
- 1324 Thornburg St
- 1620 Walnut St
- 000 S Spiceland Pike
- 000 Wittenbraker Ave
- 706 S Main St
- 1616 Carpenter Ct
- 422 S 18th St
- 00 N Main St
- 917 S 15th St
- 2003 Walnut St
- 1126 Webster Ave
- 620 Black Rd