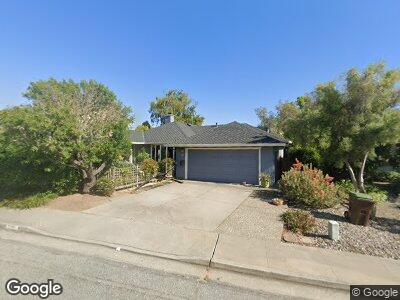
221 Seaborg Place Santa Cruz, CA 95060
Western Drive-Nobel NeighborhoodEstimated Value: $1,526,000 - $1,626,000
3
Beds
2
Baths
1,645
Sq Ft
$953/Sq Ft
Est. Value
About This Home
This home is located at 221 Seaborg Place, Santa Cruz, CA 95060 and is currently estimated at $1,567,039, approximately $952 per square foot. 221 Seaborg Place is a home located in Santa Cruz County with nearby schools including Westlake Elementary School, Mission Hill Middle School, and Santa Cruz High School.
Ownership History
Date
Name
Owned For
Owner Type
Purchase Details
Closed on
Mar 30, 2010
Sold by
Davenport Stephen L and Davenport Julia C
Bought by
Robinson Jonathan and Choi Michelle
Current Estimated Value
Home Financials for this Owner
Home Financials are based on the most recent Mortgage that was taken out on this home.
Original Mortgage
$677,700
Outstanding Balance
$561,149
Interest Rate
4.88%
Mortgage Type
Purchase Money Mortgage
Estimated Equity
$1,067,956
Purchase Details
Closed on
Jun 27, 2003
Sold by
Davenport Stephen L and Davenport Julia C
Bought by
Davenport Stephen L and Davenport Julia C
Create a Home Valuation Report for This Property
The Home Valuation Report is an in-depth analysis detailing your home's value as well as a comparison with similar homes in the area
Home Values in the Area
Average Home Value in this Area
Purchase History
| Date | Buyer | Sale Price | Title Company |
|---|---|---|---|
| Robinson Jonathan | $753,000 | Old Republic Title Company | |
| Davenport Stephen L | -- | -- |
Source: Public Records
Mortgage History
| Date | Status | Borrower | Loan Amount |
|---|---|---|---|
| Open | Robinson Jonathan | $677,700 | |
| Previous Owner | Davenport Stephen L | $100,000 | |
| Previous Owner | Davenport Stephen L | $235,000 | |
| Previous Owner | Davenport Stephen L | $200,000 | |
| Previous Owner | Davenport Stephen L | $75,000 | |
| Previous Owner | Davenport Stephen L | $125,000 |
Source: Public Records
Tax History Compared to Growth
Tax History
| Year | Tax Paid | Tax Assessment Tax Assessment Total Assessment is a certain percentage of the fair market value that is determined by local assessors to be the total taxable value of land and additions on the property. | Land | Improvement |
|---|---|---|---|---|
| 2023 | $10,673 | $934,252 | $558,318 | $375,934 |
| 2022 | $10,553 | $915,932 | $547,370 | $368,562 |
| 2021 | $10,334 | $897,974 | $536,638 | $361,336 |
| 2020 | $10,253 | $888,766 | $531,136 | $357,630 |
| 2019 | $10,029 | $871,338 | $520,720 | $350,618 |
| 2018 | $9,915 | $854,254 | $510,510 | $343,744 |
| 2017 | $9,788 | $837,504 | $500,502 | $337,002 |
| 2016 | $9,244 | $821,082 | $490,688 | $330,394 |
| 2015 | $9,042 | $808,750 | $483,318 | $325,432 |
| 2014 | $8,890 | $792,908 | $473,850 | $319,058 |
Source: Public Records
Map
Nearby Homes
- 115 Crestview Terrace
- 106 Palo Verde Terrace
- 131 Palo Verde Terrace
- 165 Westview Ct
- 0 Alta Vista Dr
- 120 Alamo Ave
- 220 Kenneth St
- 309 Village Cir
- 501 Village Cir
- 161 Bradley Dr
- 626 Laurent St
- 41 Grandview St Unit 705
- 41 Grandview St Unit 1001
- 1412 Bay St
- 110 Limestone Ln
- 623 High St
- 128 Otis St
- 221 Heath St
- 603 Mission St
- 139 Naglee Ave