2220 E Murray Holladay Rd Unit 224 Salt Lake City, UT 84117
Estimated Value: $271,000 - $294,000
2
Beds
2
Baths
1,003
Sq Ft
$281/Sq Ft
Est. Value
About This Home
This home is located at 2220 E Murray Holladay Rd Unit 224, Salt Lake City, UT 84117 and is currently estimated at $281,707, approximately $280 per square foot. 2220 E Murray Holladay Rd Unit 224 is a home located in Salt Lake County with nearby schools including Cottonwood Elementary School, Olympus Junior High School, and Olympus High School.
Ownership History
Date
Name
Owned For
Owner Type
Purchase Details
Closed on
Mar 1, 2000
Sold by
Elwell David George and Elwell Sharon
Bought by
Elwell David George and Elwell Sharon
Current Estimated Value
Purchase Details
Closed on
Oct 25, 1999
Sold by
Elwell Sharon
Bought by
Elwell David G and Elwell Sharon
Home Financials for this Owner
Home Financials are based on the most recent Mortgage that was taken out on this home.
Original Mortgage
$48,000
Interest Rate
7.86%
Purchase Details
Closed on
Oct 22, 1999
Sold by
Bingham Melvin Ray
Bought by
Elwell Sharon
Home Financials for this Owner
Home Financials are based on the most recent Mortgage that was taken out on this home.
Original Mortgage
$48,000
Interest Rate
7.86%
Purchase Details
Closed on
Feb 13, 1995
Sold by
First American Title Company Of Utah
Bought by
Associated Title Company
Purchase Details
Closed on
Nov 18, 1994
Sold by
Terry Susanne R
Bought by
Bingham Lauretta D
Create a Home Valuation Report for This Property
The Home Valuation Report is an in-depth analysis detailing your home's value as well as a comparison with similar homes in the area
Home Values in the Area
Average Home Value in this Area
Purchase History
| Date | Buyer | Sale Price | Title Company |
|---|---|---|---|
| Elwell David George | -- | -- | |
| Elwell David G | -- | Associated Title | |
| Elwell Sharon | -- | Associated Title | |
| Bingham Lauretta D | -- | -- |
Source: Public Records
Mortgage History
| Date | Status | Borrower | Loan Amount |
|---|---|---|---|
| Closed | Elwell David G | $48,000 |
Source: Public Records
Tax History Compared to Growth
Tax History
| Year | Tax Paid | Tax Assessment Tax Assessment Total Assessment is a certain percentage of the fair market value that is determined by local assessors to be the total taxable value of land and additions on the property. | Land | Improvement |
|---|---|---|---|---|
| 2023 | $56 | $265,400 | $79,600 | $185,800 |
| 2022 | $0 | $257,000 | $77,100 | $179,900 |
| 2021 | $1,669 | $200,100 | $60,000 | $140,100 |
| 2020 | $1,086 | $165,700 | $49,700 | $116,000 |
| 2019 | $87 | $160,100 | $48,000 | $112,100 |
| 2018 | $179 | $143,500 | $43,000 | $100,500 |
| 2017 | $59 | $124,800 | $37,400 | $87,400 |
| 2016 | $766 | $114,600 | $34,400 | $80,200 |
| 2015 | $766 | $109,100 | $32,700 | $76,400 |
| 2014 | -- | $108,000 | $32,400 | $75,600 |
Source: Public Records
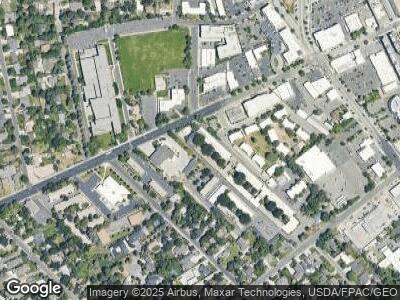
Map
Nearby Homes
- 2250 Murray Holladay Rd Unit 301
- 2250 Murray Holladay Rd Unit 201
- 2250 Murray Holladay Rd Unit 302
- 2260 E Murray Holladay Rd Unit 32
- 2260 E Murray Holladay Rd Unit 24
- 2220 E Murray Holladay Rd Unit 218
- 2220 E Murray Holladay Rd Unit 23
- 2220 E Murray Holladay Rd Unit 140
- 2220 E Murray Holladay Rd Unit 122
- 2250 E Murray Holladay Rd Unit 308
- 2250 E Murray Holladay Rd Unit 312
- 2250 E Murray Holladay Rd Unit 201
- 4928 S Beverly Ct
- 2220 E Murray Holladay Rd #204 Rd S
- 2270 E Murray Holladay Rd Unit 15
- 2240 E Laney Ave Unit 203
- 4801 S Bonair St
- 2340 E Phylden Dr Unit 204b
- 4822 S Holladay Blvd Unit 110
- 4822 S Holladay Blvd Unit 160