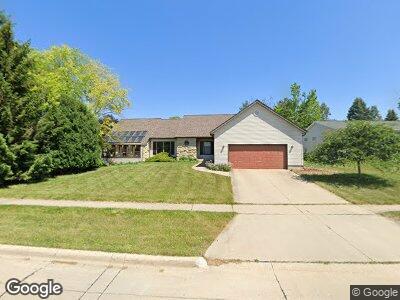
2221 W 8th St Cedar Falls, IA 50613
Hearthside NeighborhoodEstimated Value: $335,396 - $403,000
3
Beds
2
Baths
2,367
Sq Ft
$157/Sq Ft
Est. Value
About This Home
This home is located at 2221 W 8th St, Cedar Falls, IA 50613 and is currently estimated at $371,349, approximately $156 per square foot. 2221 W 8th St is a home located in Black Hawk County with nearby schools including Helen A. Hansen Elementary School, Holmes Junior High School, and Cedar Falls High School.
Create a Home Valuation Report for This Property
The Home Valuation Report is an in-depth analysis detailing your home's value as well as a comparison with similar homes in the area
Home Values in the Area
Average Home Value in this Area
Tax History Compared to Growth
Tax History
| Year | Tax Paid | Tax Assessment Tax Assessment Total Assessment is a certain percentage of the fair market value that is determined by local assessors to be the total taxable value of land and additions on the property. | Land | Improvement |
|---|---|---|---|---|
| 2024 | $4,950 | $334,060 | $44,460 | $289,600 |
| 2023 | $5,272 | $334,060 | $44,460 | $289,600 |
| 2022 | $5,334 | $294,500 | $44,460 | $250,040 |
| 2021 | $5,048 | $294,500 | $44,460 | $250,040 |
| 2020 | $4,944 | $279,680 | $29,640 | $250,040 |
| 2019 | $4,944 | $279,680 | $29,640 | $250,040 |
| 2018 | $4,706 | $263,320 | $29,640 | $233,680 |
| 2017 | $4,810 | $263,320 | $29,640 | $233,680 |
| 2016 | $4,500 | $263,320 | $29,640 | $233,680 |
| 2015 | $4,500 | $263,320 | $29,640 | $233,680 |
| 2014 | $4,552 | $263,320 | $29,640 | $233,680 |
Source: Public Records
Map
Nearby Homes
- 2219 Coventry Ln
- 2711 Fandre Dr
- 3011 Abraham Dr
- 1604 W 8th St
- 113 Cedar Crest Dr
- 1014 Ellen St
- 2912 W 4th St
- 2911 W 3rd St Unit B
- 1306 W 6th St
- 1409 W 4th St
- 3035 Pheasant Dr Unit B
- 0 W 1st St
- 1115 W 11th St
- 3123 Apollo St
- 1204 W 3rd St
- 1023 W 10th St
- 1123 W 3rd St
- 603 Eagle Ridge Rd
- 307 N Francis St
- 1111 College St