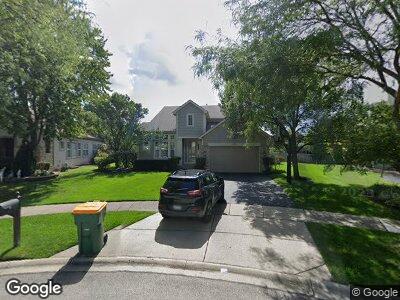
2235 Avalon Ct S Buffalo Grove, IL 60089
Northeast Buffalo Grove NeighborhoodEstimated Value: $785,043 - $902,000
--
Bed
3
Baths
3,243
Sq Ft
$265/Sq Ft
Est. Value
About This Home
This home is located at 2235 Avalon Ct S, Buffalo Grove, IL 60089 and is currently estimated at $859,261, approximately $264 per square foot. 2235 Avalon Ct S is a home located in Lake County with nearby schools including Meridian Middle School, Earl Pritchett School, and Aptakisic Junior High School.
Ownership History
Date
Name
Owned For
Owner Type
Purchase Details
Closed on
Nov 1, 2022
Sold by
Wilk Jeffrey S and Wilk Wendy H
Bought by
Jeffrey S Wilk Declaration Of Trust and Wendy H Wilk Declaration Of Trust
Current Estimated Value
Purchase Details
Closed on
Jun 5, 2001
Sold by
Wilk Jeffrey S
Bought by
Wilk Jeffrey S and Wilk Wendy H
Home Financials for this Owner
Home Financials are based on the most recent Mortgage that was taken out on this home.
Original Mortgage
$50,000
Interest Rate
7.05%
Mortgage Type
Credit Line Revolving
Purchase Details
Closed on
Jul 24, 2000
Sold by
Wicki Beat
Bought by
Wilk Jeffrey S
Home Financials for this Owner
Home Financials are based on the most recent Mortgage that was taken out on this home.
Original Mortgage
$325,000
Interest Rate
8.19%
Purchase Details
Closed on
Dec 31, 1997
Sold by
Pinnacle Corp
Bought by
Wicki Beat
Home Financials for this Owner
Home Financials are based on the most recent Mortgage that was taken out on this home.
Original Mortgage
$100,000
Interest Rate
7%
Create a Home Valuation Report for This Property
The Home Valuation Report is an in-depth analysis detailing your home's value as well as a comparison with similar homes in the area
Home Values in the Area
Average Home Value in this Area
Purchase History
| Date | Buyer | Sale Price | Title Company |
|---|---|---|---|
| Jeffrey S Wilk Declaration Of Trust | -- | -- | |
| Wilk Jeffrey S | -- | -- | |
| Wilk Jeffrey S | $440,000 | -- | |
| Wicki Beat | $369,500 | Chicago Title Insurance Co |
Source: Public Records
Mortgage History
| Date | Status | Borrower | Loan Amount |
|---|---|---|---|
| Previous Owner | Wilk Jeffrey S | $250,000 | |
| Previous Owner | Wilk Jeffrey S | $250,000 | |
| Previous Owner | Wilk Jeffrey S | $322,000 | |
| Previous Owner | Wilk Jeffrey S | $297,000 | |
| Previous Owner | Wilk Jeffrey S | $300,700 | |
| Previous Owner | Wilk Jeffrey S | $50,000 | |
| Previous Owner | Wilk Jeffrey S | $325,000 | |
| Previous Owner | Wilk Jeffrey S | $325,000 | |
| Previous Owner | Wicki Beat | $100,000 |
Source: Public Records
Tax History Compared to Growth
Tax History
| Year | Tax Paid | Tax Assessment Tax Assessment Total Assessment is a certain percentage of the fair market value that is determined by local assessors to be the total taxable value of land and additions on the property. | Land | Improvement |
|---|---|---|---|---|
| 2023 | $18,650 | $223,353 | $51,471 | $171,882 |
| 2022 | $18,650 | $196,890 | $45,373 | $151,517 |
| 2021 | $17,991 | $194,767 | $44,884 | $149,883 |
| 2020 | $17,639 | $195,431 | $45,037 | $150,394 |
| 2019 | $17,171 | $194,711 | $44,871 | $149,840 |
| 2018 | $17,024 | $192,710 | $48,082 | $144,628 |
| 2017 | $16,805 | $188,212 | $46,960 | $141,252 |
| 2016 | $17,823 | $197,345 | $44,968 | $152,377 |
| 2015 | $17,488 | $184,556 | $42,054 | $142,502 |
| 2014 | $15,691 | $164,410 | $45,165 | $119,245 |
| 2012 | $15,184 | $164,740 | $45,256 | $119,484 |
Source: Public Records
Map
Nearby Homes
- 2259 Avalon Dr
- 2209 Avalon Dr
- 16202 W Aptakisic Rd
- 1533 Madison Ct N
- 224 Hoffman Dr
- 2459 Waterbury Ln
- 2225 Apple Hill Ln
- 42 Chestnut Ct W
- 62 Chestnut Terrace
- 86 Willow Pkwy Unit 782
- 2445 Palazzo Dr
- 22824 N Prairie Rd
- 93 Willow Pkwy Unit 691
- 2470 Palazzo Ct
- 2607 Chelsey St
- 2461 Madiera Ln
- 2164 Brandywyn Ln Unit 2213
- 559 Coventry Ln
- 1224 Clearview Ct Unit 12-24
- 1232 Clearview Ct