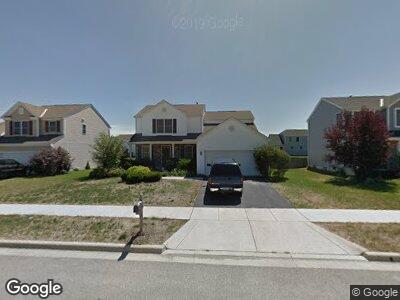
224 Rockmill St Delaware, OH 43015
Estimated Value: $380,000 - $397,000
4
Beds
3
Baths
2,086
Sq Ft
$186/Sq Ft
Est. Value
About This Home
This home is located at 224 Rockmill St, Delaware, OH 43015 and is currently estimated at $388,059, approximately $186 per square foot. 224 Rockmill St is a home located in Delaware County with nearby schools including Robert F. Schultz Elementary School, John C. Dempsey Middle School, and Rutherford B. Hayes High School.
Ownership History
Date
Name
Owned For
Owner Type
Purchase Details
Closed on
Jul 4, 2024
Sold by
Coss Eric E
Bought by
Reynolds Group Llc
Current Estimated Value
Home Financials for this Owner
Home Financials are based on the most recent Mortgage that was taken out on this home.
Original Mortgage
$300,000
Outstanding Balance
$297,708
Interest Rate
6.94%
Mortgage Type
Credit Line Revolving
Estimated Equity
$90,351
Purchase Details
Closed on
Jan 16, 2006
Sold by
Dominion Homes Inc
Bought by
Coss Eric E
Home Financials for this Owner
Home Financials are based on the most recent Mortgage that was taken out on this home.
Original Mortgage
$184,892
Interest Rate
6.46%
Mortgage Type
FHA
Create a Home Valuation Report for This Property
The Home Valuation Report is an in-depth analysis detailing your home's value as well as a comparison with similar homes in the area
Home Values in the Area
Average Home Value in this Area
Purchase History
| Date | Buyer | Sale Price | Title Company |
|---|---|---|---|
| Reynolds Group Llc | $375,000 | Northwest Advantage Title | |
| Coss Eric E | $195,200 | Alliance Title |
Source: Public Records
Mortgage History
| Date | Status | Borrower | Loan Amount |
|---|---|---|---|
| Open | Reynolds Group Llc | $300,000 | |
| Previous Owner | Coss Eric E | $230,362 | |
| Previous Owner | Coss Eric E | $190,272 | |
| Previous Owner | Coss Eric E | $163,816 | |
| Previous Owner | Coss Eric E | $24,000 | |
| Previous Owner | Coss Eric E | $184,892 |
Source: Public Records
Tax History Compared to Growth
Tax History
| Year | Tax Paid | Tax Assessment Tax Assessment Total Assessment is a certain percentage of the fair market value that is determined by local assessors to be the total taxable value of land and additions on the property. | Land | Improvement |
|---|---|---|---|---|
| 2024 | $5,400 | $114,380 | $19,600 | $94,780 |
| 2023 | $5,410 | $114,380 | $19,600 | $94,780 |
| 2022 | $4,760 | $87,330 | $15,930 | $71,400 |
| 2021 | $4,865 | $87,330 | $15,930 | $71,400 |
| 2020 | $4,920 | $87,330 | $15,930 | $71,400 |
| 2019 | $4,589 | $73,820 | $12,250 | $61,570 |
| 2018 | $4,653 | $73,820 | $12,250 | $61,570 |
| 2017 | $4,213 | $66,010 | $11,200 | $54,810 |
| 2016 | $3,797 | $66,010 | $11,200 | $54,810 |
| 2015 | $3,818 | $66,010 | $11,200 | $54,810 |
| 2014 | $3,879 | $66,010 | $11,200 | $54,810 |
| 2013 | $3,900 | $66,010 | $11,200 | $54,810 |
Source: Public Records
Map
Nearby Homes
- 216 Rockmill St
- 252 Leawood Dr
- 226 Hayfield Dr
- 0 S Houk Rd
- 101 Flint Rock Dr Unit 9316
- 730 Swanson St
- 724 Swanson St
- 831 Summerville Dr
- 4434 Marysville Rd
- 743 Clymer St
- 695 Clymer St
- 81 Marvin Ln
- 82 Delaware Dr
- 621 W William St
- 191 Bevan Way
- 23 Penick Ave
- 268 Aaron Dr
- 447 Blaisdell Dr
- 178 Franks Field Dr Unit Lot 13920
- 483 Penwell Dr Unit Lot 13914