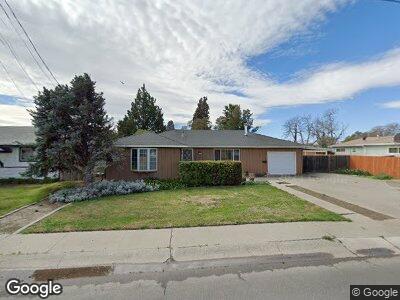
225 Cynthia Dr Colusa, CA 95932
Estimated Value: $367,000 - $401,000
3
Beds
2
Baths
1,452
Sq Ft
$265/Sq Ft
Est. Value
About This Home
This home is located at 225 Cynthia Dr, Colusa, CA 95932 and is currently estimated at $384,846, approximately $265 per square foot. 225 Cynthia Dr is a home located in Colusa County with nearby schools including James M. Burchfield Primary School, George T. Egling Middle School, and Colusa High School.
Ownership History
Date
Name
Owned For
Owner Type
Purchase Details
Closed on
Jan 30, 2017
Sold by
Moran John P
Bought by
Moran John P and The John P Moran Living Trust
Current Estimated Value
Purchase Details
Closed on
Mar 27, 2006
Sold by
Moran John P
Bought by
Moran John P
Home Financials for this Owner
Home Financials are based on the most recent Mortgage that was taken out on this home.
Original Mortgage
$125,000
Interest Rate
6.25%
Mortgage Type
Fannie Mae Freddie Mac
Create a Home Valuation Report for This Property
The Home Valuation Report is an in-depth analysis detailing your home's value as well as a comparison with similar homes in the area
Home Values in the Area
Average Home Value in this Area
Purchase History
| Date | Buyer | Sale Price | Title Company |
|---|---|---|---|
| Moran John P | -- | None Available | |
| Moran John P | -- | National Div United Title |
Source: Public Records
Mortgage History
| Date | Status | Borrower | Loan Amount |
|---|---|---|---|
| Closed | Moran John P | $120,500 | |
| Closed | Moran John P | $125,000 |
Source: Public Records
Tax History Compared to Growth
Tax History
| Year | Tax Paid | Tax Assessment Tax Assessment Total Assessment is a certain percentage of the fair market value that is determined by local assessors to be the total taxable value of land and additions on the property. | Land | Improvement |
|---|---|---|---|---|
| 2024 | $1,702 | $147,789 | $36,036 | $111,753 |
| 2023 | $1,634 | $144,892 | $35,330 | $109,562 |
| 2022 | $1,636 | $142,052 | $34,638 | $107,414 |
| 2021 | $1,572 | $139,267 | $33,959 | $105,308 |
| 2020 | $1,554 | $137,840 | $33,611 | $104,229 |
| 2019 | $1,514 | $135,138 | $32,952 | $102,186 |
| 2018 | $1,514 | $132,489 | $32,306 | $100,183 |
| 2017 | $1,491 | $129,892 | $31,673 | $98,219 |
| 2016 | $1,472 | $127,346 | $31,052 | $96,294 |
| 2015 | $1,451 | $125,434 | $30,586 | $94,848 |
| 2014 | $1,378 | $122,978 | $29,987 | $92,991 |
Source: Public Records