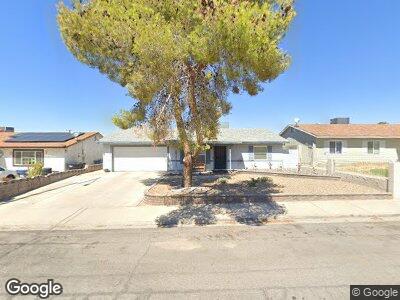
225 Tonalea Ave Henderson, NV 89015
Valley View NeighborhoodEstimated Value: $291,000 - $344,000
2
Beds
1
Bath
900
Sq Ft
$352/Sq Ft
Est. Value
About This Home
This home is located at 225 Tonalea Ave, Henderson, NV 89015 and is currently estimated at $316,385, approximately $351 per square foot. 225 Tonalea Ave is a home located in Clark County with nearby schools including C T Sewell Elementary School, B Mahlon Brown Academy of International Studies, and Basic Academy of International Studies.
Ownership History
Date
Name
Owned For
Owner Type
Purchase Details
Closed on
Sep 29, 2009
Sold by
Burke Sharon
Bought by
Ambrosia Sharon
Current Estimated Value
Purchase Details
Closed on
Jan 23, 2008
Sold by
Burke Sharon and Burke Rodney
Bought by
Burke Sharon
Purchase Details
Closed on
Jun 27, 2006
Sold by
Burke Sharon and Burke Rodney
Bought by
Burke Rodney and Burke Sharon
Home Financials for this Owner
Home Financials are based on the most recent Mortgage that was taken out on this home.
Original Mortgage
$97,100
Interest Rate
6.63%
Mortgage Type
Stand Alone Refi Refinance Of Original Loan
Purchase Details
Closed on
Apr 1, 2002
Sold by
Ambrosia Sharon L and Ambrosia Todd W
Bought by
Ambrosia Sharon L
Purchase Details
Closed on
Jan 15, 1999
Sold by
Mullis Roger and Mullis Tina
Bought by
Ambrosia Todd W and Ambrosia Sharon L
Home Financials for this Owner
Home Financials are based on the most recent Mortgage that was taken out on this home.
Original Mortgage
$76,500
Interest Rate
8.99%
Create a Home Valuation Report for This Property
The Home Valuation Report is an in-depth analysis detailing your home's value as well as a comparison with similar homes in the area
Home Values in the Area
Average Home Value in this Area
Purchase History
| Date | Buyer | Sale Price | Title Company |
|---|---|---|---|
| Ambrosia Sharon | -- | None Available | |
| Burke Sharon | -- | None Available | |
| Burke Rodney | -- | Equity Title Of Nevada | |
| Ambrosia Sharon L | -- | -- | |
| Ambrosia Todd W | $90,000 | Nevada Title Company |
Source: Public Records
Mortgage History
| Date | Status | Borrower | Loan Amount |
|---|---|---|---|
| Open | Ambrosia Sharon | $82,750 | |
| Previous Owner | Burke Rodney | $97,100 | |
| Previous Owner | Ambrosia Todd W | $76,500 | |
| Closed | Ambrosia Todd W | $13,500 |
Source: Public Records
Tax History Compared to Growth
Tax History
| Year | Tax Paid | Tax Assessment Tax Assessment Total Assessment is a certain percentage of the fair market value that is determined by local assessors to be the total taxable value of land and additions on the property. | Land | Improvement |
|---|---|---|---|---|
| 2025 | $623 | $46,762 | $28,000 | $18,762 |
| 2024 | $606 | $46,762 | $28,000 | $18,762 |
| 2023 | $606 | $45,897 | $27,300 | $18,597 |
| 2022 | $588 | $41,500 | $24,150 | $17,350 |
| 2021 | $571 | $38,128 | $21,350 | $16,778 |
| 2020 | $551 | $38,345 | $21,350 | $16,995 |
| 2019 | $535 | $33,140 | $16,100 | $17,040 |
| 2018 | $520 | $29,965 | $13,300 | $16,665 |
| 2017 | $830 | $28,643 | $11,550 | $17,093 |
| 2016 | $494 | $24,380 | $6,650 | $17,730 |
| 2015 | $491 | $24,417 | $6,650 | $17,767 |
| 2014 | $477 | $15,973 | $5,250 | $10,723 |
Source: Public Records
Map
Nearby Homes
- 232 Meyers Ave
- 250 Tonalea Ave
- 213 Valley Forge Ave
- 576 Bayo Canyon Ct
- 223 Mojave Ln
- 337 Mattie Brook Ave
- 209 Mojave Ln
- 308 Belfast St
- 319 Belfast St
- 0 N Pueblo Blvd
- 308 Cannes St
- 238 Piute Ln
- 402 Bell Ave
- 1065 Admiral Emblem St
- 1111 E Warm Springs Rd
- 1055 Admiral Emblem St
- 1045 Spotted Saddle St
- 1035 Spotted Saddle St
- 143 Constitution Ave
- 915 N Major Ave