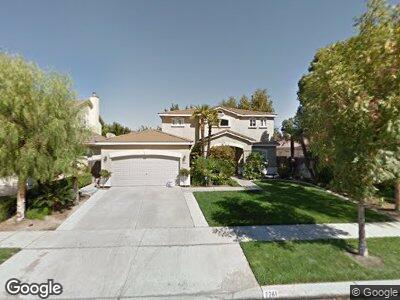
2261 Arabian Way Turlock, CA 95380
Northwest Triangle NeighborhoodEstimated Value: $483,000 - $555,000
4
Beds
3
Baths
1,880
Sq Ft
$275/Sq Ft
Est. Value
About This Home
This home is located at 2261 Arabian Way, Turlock, CA 95380 and is currently estimated at $516,604, approximately $274 per square foot. 2261 Arabian Way is a home located in Stanislaus County with nearby schools including Walter M. Brown Elementary School, Turlock Junior High School, and Marvin A. Dutcher Middle School.
Ownership History
Date
Name
Owned For
Owner Type
Purchase Details
Closed on
Oct 21, 2019
Sold by
Kellstrom Teresa A
Bought by
Revoca Kellstrom Teresa A
Current Estimated Value
Purchase Details
Closed on
Jul 11, 2017
Sold by
Kellstrom Matthew T
Bought by
Kellstrom Teresa A
Home Financials for this Owner
Home Financials are based on the most recent Mortgage that was taken out on this home.
Original Mortgage
$144,000
Interest Rate
3.94%
Mortgage Type
New Conventional
Purchase Details
Closed on
Feb 22, 1999
Sold by
Jkb Homes Corp
Bought by
Kellstrom Matthew T and Kellstrom Teresa A
Home Financials for this Owner
Home Financials are based on the most recent Mortgage that was taken out on this home.
Original Mortgage
$147,300
Interest Rate
7.04%
Mortgage Type
Purchase Money Mortgage
Create a Home Valuation Report for This Property
The Home Valuation Report is an in-depth analysis detailing your home's value as well as a comparison with similar homes in the area
Home Values in the Area
Average Home Value in this Area
Purchase History
| Date | Buyer | Sale Price | Title Company |
|---|---|---|---|
| Revoca Kellstrom Teresa A | -- | None Available | |
| Kellstrom Teresa A | -- | First American Title Company | |
| Kellstrom Matthew T | $155,500 | Fidelity National Title Co |
Source: Public Records
Mortgage History
| Date | Status | Borrower | Loan Amount |
|---|---|---|---|
| Open | Kellstrom Teresa A | $141,000 | |
| Closed | Kellstrom Teresa A | $144,000 | |
| Closed | Kellstrom Matthew T | $61,003 | |
| Closed | Kellstrom Teresa A | $150,500 | |
| Previous Owner | Kellstrom Matthew T | $147,300 |
Source: Public Records
Tax History Compared to Growth
Tax History
| Year | Tax Paid | Tax Assessment Tax Assessment Total Assessment is a certain percentage of the fair market value that is determined by local assessors to be the total taxable value of land and additions on the property. | Land | Improvement |
|---|---|---|---|---|
| 2024 | $2,894 | $238,215 | $53,785 | $184,430 |
| 2023 | $3,047 | $233,545 | $52,731 | $180,814 |
| 2022 | $3,004 | $228,967 | $51,698 | $177,269 |
| 2021 | $2,923 | $224,479 | $50,685 | $173,794 |
| 2020 | $2,893 | $222,178 | $50,166 | $172,012 |
| 2019 | $2,832 | $217,823 | $49,183 | $168,640 |
| 2018 | $2,823 | $213,553 | $48,219 | $165,334 |
| 2017 | $2,743 | $209,367 | $47,274 | $162,093 |
| 2016 | $2,579 | $205,263 | $46,348 | $158,915 |
| 2015 | $2,549 | $202,180 | $45,652 | $156,528 |
| 2014 | $2,517 | $198,220 | $44,758 | $153,462 |
Source: Public Records
Map
Nearby Homes
- 4013 W Tuolumne Rd
- 1946 Noble Ln
- 2461 Carnival Dr
- 2520 Carnival Dr
- 2800 Craftsman St
- 2755 N Walnut Rd Unit 157
- 2400 Fulkerth Rd
- 2450 Fulkerth Rd
- 2821 Messenger Ct
- 3000 W Tuolumne Rd
- 2941 Van Buren Cir
- 1400 N Tully Rd Unit 143
- 2240 Oxford Ave
- 3260 Spring Garden Dr
- 3360 Spring Garden Dr
- 2213 Dels Ln
- 3076 Radford Way
- 1253 Trinity Way
- 3513 Telluride Ln
- 765 Berea Ct