T
Seller's Agent in 2023
Tushar Dode
Ikon Realty - Ashburn
(703) 930-7609
1 in this area
46 Total Sales
Estimated Value: $633,000 - $685,000
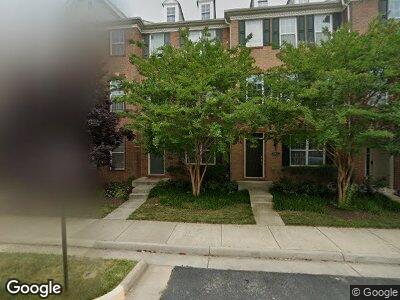
LOCATION! LOCATION! LOCATION! Few blocks away from upcoming Silver Line Ashburn Station Metro! Toll Brothers built, 2 car rear load garage, BRADLEA floor plan, 1825 sq ft on its 3 Levels * 4 Bedrooms, 3 Full Bathrooms & a Powder Room at Main Level * Maintenance-free Deck off the Kitchen * Flowing wide hardwood floors at main level * Upgraded cabinets, SS appliances, back splash & granite counters * Center Island & Buffet Bar * Washer & Dryer * Walk-In Closet @ Master Bedroom * Heart of Ashburn!! Quick access to major roads - Loudoun County Parkway & 267 Greenway/Toll. Close to Dulles International Airport, Loudoun Station, Brambleton Town Center, Dulles Landing * Future Gramercy District & Moorefield Town Square * Excellence in style, function & location *
| Date | Buyer | Sale Price | Title Company |
|---|---|---|---|
| Aavya Ventures Llc | $495,000 | Attorney | |
| Sunkara Anitha | $393,105 | -- |
| Date | Event | Price | Change | Sq Ft Price |
|---|---|---|---|---|
| 08/18/2023 08/18/23 | Rented | $2,850 | 0.0% | -- |
| 08/09/2023 08/09/23 | Price Changed | $2,850 | -5.0% | $2 / Sq Ft |
| 07/25/2023 07/25/23 | Price Changed | $3,000 | -3.2% | $2 / Sq Ft |
| 07/22/2023 07/22/23 | Price Changed | $3,100 | -3.1% | $2 / Sq Ft |
| 05/02/2023 05/02/23 | For Rent | $3,200 | +18.5% | -- |
| 06/05/2022 06/05/22 | Rented | $2,700 | -3.6% | -- |
| 05/06/2022 05/06/22 | For Rent | $2,800 | 0.0% | -- |
| 05/05/2022 05/05/22 | Under Contract | -- | -- | -- |
| 05/01/2022 05/01/22 | For Rent | $2,800 | +21.7% | -- |
| 08/09/2020 08/09/20 | Rented | $2,300 | -6.1% | -- |
| 07/23/2020 07/23/20 | For Rent | $2,450 | 0.0% | -- |
| 07/22/2020 07/22/20 | Sold | $495,000 | -1.0% | $271 / Sq Ft |
| 07/02/2020 07/02/20 | Pending | -- | -- | -- |
| 06/28/2020 06/28/20 | For Sale | $499,990 | +27.2% | $274 / Sq Ft |
| 10/29/2014 10/29/14 | Sold | $393,105 | -3.7% | $225 / Sq Ft |
| 10/01/2014 10/01/14 | Pending | -- | -- | -- |
| 08/18/2014 08/18/14 | Price Changed | $408,195 | -1.2% | $233 / Sq Ft |
| 08/01/2014 08/01/14 | Price Changed | $413,195 | -0.7% | $236 / Sq Ft |
| 07/31/2014 07/31/14 | For Sale | $416,195 | -- | $238 / Sq Ft |
| Year | Tax Paid | Tax Assessment Tax Assessment Total Assessment is a certain percentage of the fair market value that is determined by local assessors to be the total taxable value of land and additions on the property. | Land | Improvement |
|---|---|---|---|---|
| 2024 | $6,410 | $601,850 | $210,000 | $391,850 |
| 2023 | $4,941 | $564,700 | $210,000 | $354,700 |
| 2022 | $4,734 | $531,880 | $185,000 | $346,880 |
| 2021 | $4,701 | $479,650 | $150,000 | $329,650 |
| 2020 | $4,539 | $438,590 | $150,000 | $288,590 |
| 2019 | $4,550 | $435,410 | $150,000 | $285,410 |
| 2018 | $4,486 | $413,480 | $125,000 | $288,480 |
| 2017 | $4,452 | $395,690 | $125,000 | $270,690 |
| 2016 | $4,508 | $393,710 | $0 | $0 |
| 2015 | $4,644 | $284,170 | $0 | $284,170 |
| 2014 | $1,328 | $0 | $0 | $0 |
T
Seller's Agent in 2023
Tushar Dode
Ikon Realty - Ashburn
(703) 930-7609
1 in this area
46 Total Sales
N
Buyer's Agent in 2023
Non Member Member
Metropolitan Regional Information Systems

Buyer's Agent in 2022
Sridevi Miriyala
Maram Realty, LLC
(703) 981-1907
12 in this area
68 Total Sales
Seller's Agent in 2020
Sri Meka
Franklin Realty LLC
(703) 508-9205
10 in this area
197 Total Sales
Seller's Agent in 2014
Carla Brown
Toll Brothers Real Estate Inc.
(703) 623-3462
133 in this area
460 Total Sales
v
Buyer's Agent in 2014
venkata korupolu
Fairfax Realty Select
(571) 278-6507
19 Total Sales