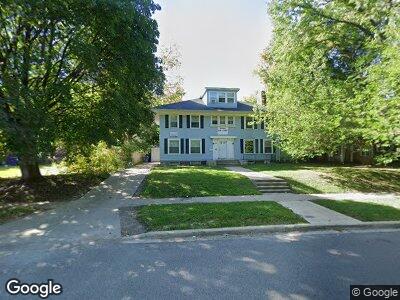
230 Augusta Ave Dekalb, IL 60115
--
Bed
--
Bath
--
Sq Ft
0.26
Acres
About This Home
This home is located at 230 Augusta Ave, Dekalb, IL 60115. 230 Augusta Ave is a home located in DeKalb County with nearby schools including Littlejohn Elementary School, Clinton Rosette Middle School, and De Kalb High School.
Ownership History
Date
Name
Owned For
Owner Type
Purchase Details
Closed on
Jan 2, 2017
Sold by
Tuntland John E and Zhang Yuwei
Bought by
Tuntland Enterprises Llc
Purchase Details
Closed on
May 8, 2015
Sold by
Jensen Trust
Bought by
Tuntland John E and Zhang Yuwei
Home Financials for this Owner
Home Financials are based on the most recent Mortgage that was taken out on this home.
Original Mortgage
$700,000
Interest Rate
3.68%
Mortgage Type
New Conventional
Purchase Details
Closed on
May 21, 2012
Sold by
Jensen Jamie B
Bought by
Jensen Trust
Purchase Details
Closed on
Oct 30, 2009
Sold by
Suddeth Robert F
Bought by
Jensen James R and Jensen Jamie B
Home Financials for this Owner
Home Financials are based on the most recent Mortgage that was taken out on this home.
Original Mortgage
$220,000
Interest Rate
5.07%
Mortgage Type
Commercial
Purchase Details
Closed on
Jun 5, 2008
Sold by
Majcher Anthony
Bought by
Suddeth Robert
Home Financials for this Owner
Home Financials are based on the most recent Mortgage that was taken out on this home.
Original Mortgage
$198,400
Interest Rate
6.01%
Mortgage Type
Commercial
Create a Home Valuation Report for This Property
The Home Valuation Report is an in-depth analysis detailing your home's value as well as a comparison with similar homes in the area
Home Values in the Area
Average Home Value in this Area
Purchase History
| Date | Buyer | Sale Price | Title Company |
|---|---|---|---|
| Tuntland Enterprises Llc | -- | -- | |
| Tuntland John E | $400,000 | -- | |
| Jensen Trust | -- | -- | |
| Jensen James R | $249,000 | -- | |
| Suddeth Robert | $248,000 | -- |
Source: Public Records
Mortgage History
| Date | Status | Borrower | Loan Amount |
|---|---|---|---|
| Previous Owner | Tuntland John E | $700,000 | |
| Previous Owner | Jensen Trust | $749,600 | |
| Previous Owner | Jensen James R | $220,000 | |
| Previous Owner | Suddeth Robert | $198,400 |
Source: Public Records
Tax History Compared to Growth
Tax History
| Year | Tax Paid | Tax Assessment Tax Assessment Total Assessment is a certain percentage of the fair market value that is determined by local assessors to be the total taxable value of land and additions on the property. | Land | Improvement |
|---|---|---|---|---|
| 2024 | $7,992 | $97,370 | $15,484 | $81,886 |
| 2023 | $7,992 | $84,899 | $13,501 | $71,398 |
| 2022 | $7,961 | $78,779 | $15,407 | $63,372 |
| 2021 | $8,176 | $73,887 | $14,450 | $59,437 |
| 2020 | $8,361 | $72,709 | $14,220 | $58,489 |
| 2019 | $8,197 | $69,852 | $13,661 | $56,191 |
| 2018 | $8,004 | $67,484 | $13,198 | $54,286 |
| 2017 | $8,080 | $64,870 | $12,687 | $52,183 |
| 2016 | $7,991 | $63,233 | $12,367 | $50,866 |
| 2015 | -- | $57,619 | $11,718 | $45,901 |
| 2014 | -- | $58,360 | $11,869 | $46,491 |
| 2013 | -- | $61,302 | $12,467 | $48,835 |
Source: Public Records
Map
Nearby Homes