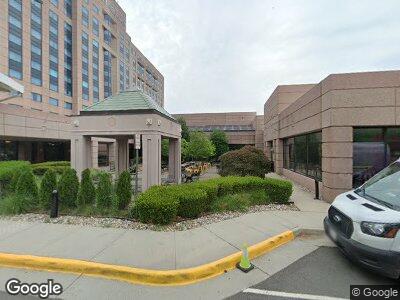
2300 Dulles Corner Blvd Herndon, VA 20171
McNair NeighborhoodEstimated Value: $61,090,574
--
Bed
--
Bath
259,340
Sq Ft
$236/Sq Ft
Est. Value
About This Home
This home is located at 2300 Dulles Corner Blvd, Herndon, VA 20171 and is currently estimated at $61,090,574, approximately $235 per square foot. 2300 Dulles Corner Blvd is a home located in Fairfax County with nearby schools including L.L. Coates Elementary School, Rachel Carson Middle School, and Westfield High School.
Ownership History
Date
Name
Owned For
Owner Type
Purchase Details
Closed on
Jun 20, 2018
Sold by
Affiliated Hotel Subsidiary Llc
Bought by
Ws Dulles Airport Llc
Current Estimated Value
Home Financials for this Owner
Home Financials are based on the most recent Mortgage that was taken out on this home.
Original Mortgage
$40,000,000
Outstanding Balance
$35,237,698
Interest Rate
4.5%
Mortgage Type
Commercial
Estimated Equity
$26,805,700
Purchase Details
Closed on
Jun 30, 2016
Sold by
Thi Iv Dulles Airport Llc
Bought by
Affiliated Hotel Subsidiary Llc
Purchase Details
Closed on
Jun 9, 2008
Sold by
Ashford Dulles Ii Llc
Bought by
Thi Iv Dulles Airport Llc
Home Financials for this Owner
Home Financials are based on the most recent Mortgage that was taken out on this home.
Original Mortgage
$59,750,000
Interest Rate
6.1%
Mortgage Type
Construction
Purchase Details
Closed on
Oct 28, 2005
Sold by
Dulles Airport Hotel Llc
Bought by
Ashford Dulles Ii Llc
Home Financials for this Owner
Home Financials are based on the most recent Mortgage that was taken out on this home.
Original Mortgage
$45,000,000
Interest Rate
5.79%
Mortgage Type
Construction
Create a Home Valuation Report for This Property
The Home Valuation Report is an in-depth analysis detailing your home's value as well as a comparison with similar homes in the area
Home Values in the Area
Average Home Value in this Area
Purchase History
| Date | Buyer | Sale Price | Title Company |
|---|---|---|---|
| Ws Dulles Airport Llc | $47,100,282 | None Available | |
| Affiliated Hotel Subsidiary Llc | -- | None Available | |
| Thi Iv Dulles Airport Llc | $73,900,000 | -- | |
| Ashford Dulles Ii Llc | $72,500,000 | -- |
Source: Public Records
Mortgage History
| Date | Status | Borrower | Loan Amount |
|---|---|---|---|
| Open | Ws Dulles Airport Llc | $40,000,000 | |
| Previous Owner | Thi Iv Dulles Airport Llc | $59,750,000 | |
| Previous Owner | Ashford Dulles Ii Llc | $45,000,000 |
Source: Public Records
Tax History Compared to Growth
Tax History
| Year | Tax Paid | Tax Assessment Tax Assessment Total Assessment is a certain percentage of the fair market value that is determined by local assessors to be the total taxable value of land and additions on the property. | Land | Improvement |
|---|---|---|---|---|
| 2024 | $517,994 | $32,711,950 | $8,559,000 | $24,152,950 |
| 2023 | $385,335 | $24,181,690 | $8,559,000 | $15,622,690 |
| 2022 | $309,476 | $18,887,780 | $8,559,000 | $10,328,780 |
| 2021 | $314,012 | $18,820,000 | $8,559,000 | $10,261,000 |
| 2020 | $743,883 | $44,318,320 | $8,559,000 | $35,759,320 |
| 2019 | $680,268 | $40,288,320 | $6,974,000 | $33,314,320 |
| 2018 | $352,253 | $30,630,700 | $6,974,000 | $23,656,700 |
| 2017 | $556,612 | $33,410,100 | $6,974,000 | $26,436,100 |
| 2016 | $550,201 | $33,074,900 | $6,974,000 | $26,100,900 |
| 2015 | $525,342 | $32,408,530 | $6,974,000 | $25,434,530 |
| 2014 | $602,575 | $37,230,490 | $6,974,000 | $30,256,490 |
Source: Public Records
Map
Nearby Homes
- 2152 Rock Hill Rd
- 2347 Liberty Loop Unit 126
- 2395 Liberty Loop
- 2442 Terra Cotta Cir
- 2315 Liberty Loop
- 2437 Liberty Loop
- 2418 Terra Cotta Cir
- 2211 Farougi Ct
- 13339 Apgar Place
- 13353 Shea Place
- 13305 Apgar Place
- 13340 Shea Place
- 13636 Innovation Station Loop
- 13634 Innovation Station Loop
- 13632 Innovation Station Loop
- 13630 Innovation Station Loop
- 13622 Innovation Station Loop
- 13616 Innovation Station Loop
- 13614 Innovation Station Loop
- 13612 Innovation Station Loop