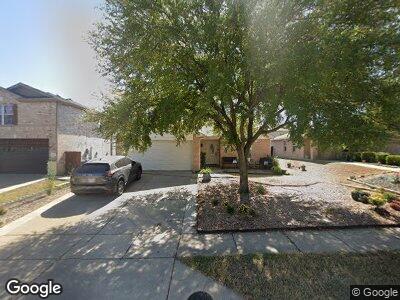
2305 Collier Dr McKinney, TX 75071
Estimated Value: $372,000 - $385,091
3
Beds
2
Baths
1,742
Sq Ft
$218/Sq Ft
Est. Value
About This Home
This home is located at 2305 Collier Dr, McKinney, TX 75071 and is currently estimated at $379,023, approximately $217 per square foot. 2305 Collier Dr is a home located in Collin County with nearby schools including Slaughter Elementary School, Dr Jack Cockrill Middle School, and McKinney Boyd High School.
Ownership History
Date
Name
Owned For
Owner Type
Purchase Details
Closed on
Dec 1, 2016
Sold by
Brown Saron and Brown Tyser
Bought by
Carlson Brian J and Carlson Tanya D
Current Estimated Value
Home Financials for this Owner
Home Financials are based on the most recent Mortgage that was taken out on this home.
Original Mortgage
$27,260
Interest Rate
3.52%
Mortgage Type
VA
Purchase Details
Closed on
Apr 25, 2013
Sold by
Robinson Saron and Brown Saron
Bought by
Brown Saron
Home Financials for this Owner
Home Financials are based on the most recent Mortgage that was taken out on this home.
Original Mortgage
$117,600
Interest Rate
3.67%
Mortgage Type
New Conventional
Purchase Details
Closed on
Dec 31, 2004
Sold by
Kb Home Lone Star Lp
Bought by
Robinson Saron
Home Financials for this Owner
Home Financials are based on the most recent Mortgage that was taken out on this home.
Original Mortgage
$101,100
Interest Rate
5.74%
Mortgage Type
Purchase Money Mortgage
Create a Home Valuation Report for This Property
The Home Valuation Report is an in-depth analysis detailing your home's value as well as a comparison with similar homes in the area
Home Values in the Area
Average Home Value in this Area
Purchase History
| Date | Buyer | Sale Price | Title Company |
|---|---|---|---|
| Carlson Brian J | -- | Chicago Title | |
| Brown Saron | -- | Providence | |
| Robinson Saron | -- | First American Title Ins Co |
Source: Public Records
Mortgage History
| Date | Status | Borrower | Loan Amount |
|---|---|---|---|
| Open | Carlson Brian J | $258,750 | |
| Closed | Carlson Brian J | $27,260 | |
| Previous Owner | Brown Saron | $117,600 | |
| Previous Owner | Robinson Saron | $101,100 | |
| Closed | Robinson Saron | $25,275 |
Source: Public Records
Tax History Compared to Growth
Tax History
| Year | Tax Paid | Tax Assessment Tax Assessment Total Assessment is a certain percentage of the fair market value that is determined by local assessors to be the total taxable value of land and additions on the property. | Land | Improvement |
|---|---|---|---|---|
| 2023 | $4,624 | $299,555 | $90,000 | $265,232 |
| 2022 | $5,457 | $272,323 | $80,000 | $256,468 |
| 2021 | $5,257 | $247,566 | $65,000 | $182,566 |
| 2020 | $5,262 | $232,833 | $50,000 | $182,833 |
| 2019 | $5,249 | $220,813 | $50,000 | $170,813 |
| 2018 | $5,450 | $224,077 | $50,000 | $174,077 |
| 2017 | $5,227 | $214,923 | $50,000 | $164,923 |
| 2016 | $4,747 | $191,199 | $50,000 | $141,199 |
| 2015 | $3,945 | $161,031 | $35,000 | $126,031 |
Source: Public Records
Map
Nearby Homes
- 2301 Glenhaven Dr
- 2204 Stonepark Place
- 2429 Emerald Ln
- 2432 Glenhaven Dr
- 316 Gwendola Dr
- 2458 Freshwater Ln
- 2425 Chapel Oaks Dr
- 2620 Gabriel Dr
- 2421 Jeans Mill Dr
- 2816 Glenhaven Dr
- 215 Gwendola Dr
- 141 Redbud Trail
- 1601 Saint Albans Dr
- 821 Austin Ln
- 202 Randy Lee Ln
- 2417 Wrexham Dr
- 2413 Shenfield Dr
- 2817 Summer Tree Ln
- 2819 Summer Tree Ln
- 2207 W University Dr