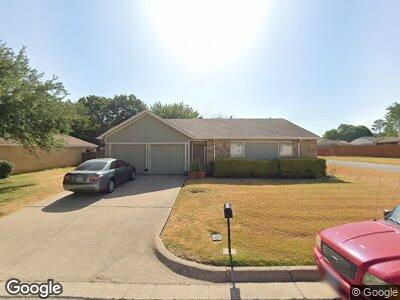
2307 Clint Ct Arlington, TX 76014
High Park Village NeighborhoodEstimated Value: $246,000 - $298,000
3
Beds
2
Baths
1,693
Sq Ft
$163/Sq Ft
Est. Value
About This Home
This home is located at 2307 Clint Ct, Arlington, TX 76014 and is currently estimated at $275,268, approximately $162 per square foot. 2307 Clint Ct is a home located in Tarrant County with nearby schools including Adams Elementary School, Workman Junior High School, and Sam Houston High School.
Ownership History
Date
Name
Owned For
Owner Type
Purchase Details
Closed on
Feb 29, 2016
Sold by
Akindeko Susila and Akindeko Kolawole
Bought by
Smith Heather and Dunham David
Current Estimated Value
Home Financials for this Owner
Home Financials are based on the most recent Mortgage that was taken out on this home.
Original Mortgage
$280,250
Interest Rate
3.92%
Mortgage Type
New Conventional
Purchase Details
Closed on
Jun 26, 2000
Sold by
Nguyen Hung
Bought by
Dang Loc Bao and Hoang San Thanh
Home Financials for this Owner
Home Financials are based on the most recent Mortgage that was taken out on this home.
Original Mortgage
$65,000
Interest Rate
8.66%
Purchase Details
Closed on
Jun 11, 1997
Sold by
Humphrey Timothy J and Humphrey Pocha R
Bought by
Nguyen Hung
Home Financials for this Owner
Home Financials are based on the most recent Mortgage that was taken out on this home.
Original Mortgage
$61,750
Interest Rate
7.93%
Create a Home Valuation Report for This Property
The Home Valuation Report is an in-depth analysis detailing your home's value as well as a comparison with similar homes in the area
Home Values in the Area
Average Home Value in this Area
Purchase History
| Date | Buyer | Sale Price | Title Company |
|---|---|---|---|
| Smith Heather | -- | Attorney | |
| Dang Loc Bao | -- | Commonwealth Land Title | |
| Nguyen Hung | -- | American Title Company |
Source: Public Records
Mortgage History
| Date | Status | Borrower | Loan Amount |
|---|---|---|---|
| Open | Smith Heather | $280,250 | |
| Previous Owner | Dang Loc Bao | $67,650 | |
| Previous Owner | Dang Loc Bao | $66,050 | |
| Previous Owner | Dang Loc Bao | $65,000 | |
| Previous Owner | Nguyen Hung | $61,750 |
Source: Public Records
Tax History Compared to Growth
Tax History
| Year | Tax Paid | Tax Assessment Tax Assessment Total Assessment is a certain percentage of the fair market value that is determined by local assessors to be the total taxable value of land and additions on the property. | Land | Improvement |
|---|---|---|---|---|
| 2024 | $2,718 | $306,000 | $90,000 | $216,000 |
| 2023 | $3,855 | $252,000 | $40,000 | $212,000 |
| 2022 | $3,950 | $213,560 | $40,000 | $173,560 |
| 2021 | $3,751 | $176,949 | $40,000 | $136,949 |
| 2020 | $3,296 | $176,949 | $40,000 | $136,949 |
| 2019 | $3,100 | $185,907 | $40,000 | $145,907 |
| 2018 | $2,338 | $108,477 | $15,000 | $93,477 |
| 2017 | $2,625 | $148,917 | $15,000 | $133,917 |
| 2016 | $2,386 | $134,599 | $15,000 | $119,599 |
| 2015 | $1,842 | $81,500 | $10,000 | $71,500 |
| 2014 | $1,842 | $81,500 | $10,000 | $71,500 |
Source: Public Records
Map
Nearby Homes
- 2307 Clearwood Ct
- 2411 Summer Place Dr
- 2324 Summer Place Dr
- 2323 Sherry St
- 2325 Sherry St
- 2335 Sherry St
- 2337 Sherry St
- 2316 Bonner Ln
- 2428 Sunflower Dr
- 2018 Kayla Ct
- 2710 Kristinwood Dr
- 2111 Avalon Ln
- 2323 Brookdale Dr
- 2325 Brookdale Dr
- 3005 Armstrong Dr
- 1811 Carla Ave
- 1800 W Queens Ct
- 1800 Galahad Ln
- 2217 Splendor Ct
- 1813 Coronado St