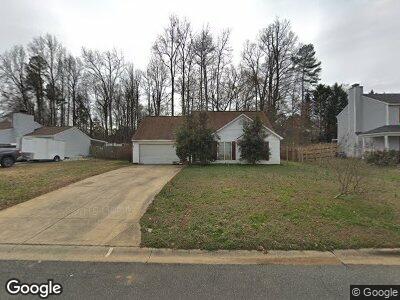
2318 Sloan Dr Charlotte, NC 28208
Toddville Road NeighborhoodEstimated Value: $286,496 - $307,000
3
Beds
2
Baths
1,143
Sq Ft
$260/Sq Ft
Est. Value
About This Home
This home is located at 2318 Sloan Dr, Charlotte, NC 28208 and is currently estimated at $297,124, approximately $259 per square foot. 2318 Sloan Dr is a home located in Mecklenburg County with nearby schools including Tuckaseegee Elementary School, Whitewater Middle School, and West Mecklenburg High.
Ownership History
Date
Name
Owned For
Owner Type
Purchase Details
Closed on
Sep 30, 2011
Sold by
Ampie Francisco R and Ampie Carolina Del Carmen
Bought by
Ampie Francisco R
Current Estimated Value
Purchase Details
Closed on
Feb 5, 2008
Sold by
Redmon Robert and Redmon Deanna M
Bought by
Ampie Franscisco R and Ampie Carolina Del Carmen
Home Financials for this Owner
Home Financials are based on the most recent Mortgage that was taken out on this home.
Original Mortgage
$100,424
Outstanding Balance
$64,754
Interest Rate
6.06%
Mortgage Type
FHA
Estimated Equity
$232,370
Purchase Details
Closed on
Oct 26, 1998
Sold by
Gill Michael W and Strickland Karen Strickland
Bought by
Redmon Robert and Adams Deanna M
Home Financials for this Owner
Home Financials are based on the most recent Mortgage that was taken out on this home.
Original Mortgage
$98,900
Interest Rate
6.76%
Mortgage Type
VA
Purchase Details
Closed on
Dec 30, 1997
Sold by
Gill Michael W and Strickland Karen Strickland
Bought by
Gill Michael William and Gill Karen Strickland
Create a Home Valuation Report for This Property
The Home Valuation Report is an in-depth analysis detailing your home's value as well as a comparison with similar homes in the area
Home Values in the Area
Average Home Value in this Area
Purchase History
| Date | Buyer | Sale Price | Title Company |
|---|---|---|---|
| Ampie Francisco R | -- | None Available | |
| Ampie Franscisco R | $102,000 | Barristers Title | |
| Redmon Robert | $97,000 | -- | |
| Gill Michael William | -- | -- |
Source: Public Records
Mortgage History
| Date | Status | Borrower | Loan Amount |
|---|---|---|---|
| Open | Ampie Franscisco R | $100,424 | |
| Previous Owner | Redmon Robert | $96,750 | |
| Previous Owner | Redmon Robert | $10,432 | |
| Previous Owner | Redmon Robert | $98,900 |
Source: Public Records
Tax History Compared to Growth
Tax History
| Year | Tax Paid | Tax Assessment Tax Assessment Total Assessment is a certain percentage of the fair market value that is determined by local assessors to be the total taxable value of land and additions on the property. | Land | Improvement |
|---|---|---|---|---|
| 2023 | $2,069 | $252,900 | $60,000 | $192,900 |
| 2022 | $1,421 | $134,200 | $32,000 | $102,200 |
| 2021 | $1,410 | $134,200 | $32,000 | $102,200 |
| 2020 | $1,402 | $134,200 | $32,000 | $102,200 |
| 2019 | $1,387 | $134,200 | $32,000 | $102,200 |
| 2018 | $1,244 | $89,200 | $18,000 | $71,200 |
| 2017 | $1,218 | $89,200 | $18,000 | $71,200 |
| 2016 | $1,208 | $89,200 | $18,000 | $71,200 |
| 2015 | $1,197 | $89,200 | $18,000 | $71,200 |
| 2014 | $1,208 | $0 | $0 | $0 |
Source: Public Records
Map
Nearby Homes
- 2609 Marmac Rd
- 2025 Sloan Dr
- 2630 Sloan Dr
- 2714 Dogwood Cir
- 5815 Katrine Ct
- 2615 Toddville Rd
- 2108 Cranberry Woods Ct
- 5821 Tuckaseegee Rd Unit 12
- 5825 Tuckaseegee Rd Unit 11
- 2706 Blackberry Ridge Ln
- 2709 Reid Meadows Dr
- 5227 Pinebrook Dr
- 5240 Pinebrook Dr
- 6400 Whitewater Dr
- 1919 Crooked Creek Dr
- 4928 Tuckaseegee Rd
- 1758 J Julian Ln
- 1754 J Julian Ln
- 1750 J Julian Ln
- 2101 Arapaho Dr