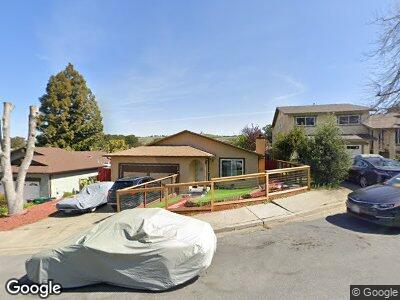
23212 Sally Ct Hayward, CA 94541
Fairview NeighborhoodEstimated Value: $645,000 - $970,000
--
Bed
--
Bath
1,164
Sq Ft
$699/Sq Ft
Est. Value
About This Home
This home is located at 23212 Sally Ct, Hayward, CA 94541 and is currently estimated at $813,551, approximately $698 per square foot. 23212 Sally Ct is a home located in Alameda County with nearby schools including Fairview Elementary School, Bret Harte Middle School, and Hayward High School.
Ownership History
Date
Name
Owned For
Owner Type
Purchase Details
Closed on
Dec 3, 2022
Sold by
Toliver Jenay L
Bought by
Jenay L Toliver Revocable Trust
Current Estimated Value
Purchase Details
Closed on
Nov 24, 2014
Sold by
Mason Karl R
Bought by
Toliver Jenay L
Home Financials for this Owner
Home Financials are based on the most recent Mortgage that was taken out on this home.
Original Mortgage
$345,000
Interest Rate
3.92%
Mortgage Type
New Conventional
Create a Home Valuation Report for This Property
The Home Valuation Report is an in-depth analysis detailing your home's value as well as a comparison with similar homes in the area
Home Values in the Area
Average Home Value in this Area
Purchase History
| Date | Buyer | Sale Price | Title Company |
|---|---|---|---|
| Jenay L Toliver Revocable Trust | -- | -- | |
| Toliver Jenay L | -- | None Available | |
| Toliver Jenay L | -- | Bnt Title Company |
Source: Public Records
Mortgage History
| Date | Status | Borrower | Loan Amount |
|---|---|---|---|
| Previous Owner | Toliver Jenay L | $383,000 | |
| Previous Owner | Toliver Janay L | $360,000 | |
| Previous Owner | Toliver Jenay L | $360,000 | |
| Previous Owner | Toliver Jenay L | $345,000 | |
| Previous Owner | Toliver Jenay L | $345,000 | |
| Previous Owner | Toliver Jenay L | $333,800 | |
| Previous Owner | Toliver Jenay L | $330,000 | |
| Previous Owner | Toliver Jenay L | $291,900 | |
| Previous Owner | Toliver Jenay L | $246,500 | |
| Previous Owner | Toliver Jenay L | $240,000 | |
| Previous Owner | Toliver Jenay L | $45,334 | |
| Previous Owner | Toliver Jenay L | $176,000 |
Source: Public Records
Tax History Compared to Growth
Tax History
| Year | Tax Paid | Tax Assessment Tax Assessment Total Assessment is a certain percentage of the fair market value that is determined by local assessors to be the total taxable value of land and additions on the property. | Land | Improvement |
|---|---|---|---|---|
| 2024 | $3,367 | $216,033 | $82,542 | $140,491 |
| 2023 | $3,348 | $218,660 | $80,924 | $137,736 |
| 2022 | $3,261 | $207,373 | $79,337 | $135,036 |
| 2021 | $3,207 | $203,169 | $77,781 | $132,388 |
| 2020 | $3,143 | $208,015 | $76,984 | $131,031 |
| 2019 | $3,141 | $203,937 | $75,475 | $128,462 |
| 2018 | $2,960 | $199,938 | $73,995 | $125,943 |
| 2017 | $2,885 | $196,018 | $72,544 | $123,474 |
| 2016 | $2,706 | $192,175 | $71,122 | $121,053 |
| 2015 | $2,645 | $189,289 | $70,054 | $119,235 |
| 2014 | $2,528 | $185,582 | $68,682 | $116,900 |
Source: Public Records
Map
Nearby Homes
- 24107 Machado Ct
- 23066 Maud Ave
- 22625 Orion St
- 22938 Canyon Terrace Dr Unit U4
- 23069 Canyon Terrace Dr Unit 1
- 24552 Karina Ct
- 24580 Karina Ct
- 3109 Vista Ln
- 25669 Crestfield Cir
- 3264 Monika Ln
- 23920 Mayville Dr
- 23229 Canyon Terrace Dr Unit 1
- 25657 Crestfield Dr
- 2566 Hermosa Terrace
- 25729 Durrwood Ct
- 24288 Stacey Ln
- 22882 Upland Way
- 25358 Gold Hills Dr
- 0 Jensen Rd Unit 41089385
- 2461 Centennial Ln