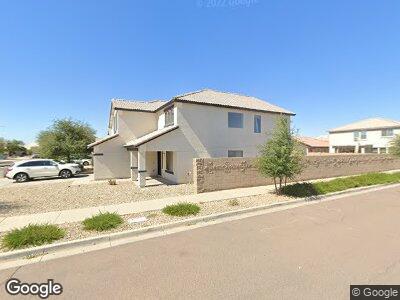
2326 W Gaby Rd Phoenix, AZ 85041
South Mountain NeighborhoodEstimated Value: $437,193 - $464,000
4
Beds
3
Baths
2,348
Sq Ft
$193/Sq Ft
Est. Value
About This Home
This home is located at 2326 W Gaby Rd, Phoenix, AZ 85041 and is currently estimated at $454,048, approximately $193 per square foot. 2326 W Gaby Rd is a home located in Maricopa County with nearby schools including Bernard Black Elementary School, Cesar Chavez High School, and Phoenix Coding Academy.
Ownership History
Date
Name
Owned For
Owner Type
Purchase Details
Closed on
May 5, 2021
Sold by
Chea Kim Heng and Sieng Lily
Bought by
Outhen Chamnan and Outhen Alvin
Current Estimated Value
Home Financials for this Owner
Home Financials are based on the most recent Mortgage that was taken out on this home.
Original Mortgage
$370,000
Outstanding Balance
$340,956
Interest Rate
3.1%
Mortgage Type
Seller Take Back
Estimated Equity
$113,867
Purchase Details
Closed on
Jan 27, 2017
Sold by
Sieng Lily and Pring Khoeun
Bought by
Sieng Lily and Chea Kim Heng
Purchase Details
Closed on
Jul 29, 2008
Sold by
Richmond American Homes Of Arizona Inc
Bought by
Sieng Lily and Pring Khoeun
Home Financials for this Owner
Home Financials are based on the most recent Mortgage that was taken out on this home.
Original Mortgage
$152,700
Interest Rate
6.32%
Mortgage Type
New Conventional
Create a Home Valuation Report for This Property
The Home Valuation Report is an in-depth analysis detailing your home's value as well as a comparison with similar homes in the area
Home Values in the Area
Average Home Value in this Area
Purchase History
| Date | Buyer | Sale Price | Title Company |
|---|---|---|---|
| Outhen Chamnan | $400,000 | Commonwealth Land Ttl Ins Co | |
| Sieng Lily | -- | None Available | |
| Sieng Lily | $203,610 | Fidelity National Title Ins |
Source: Public Records
Mortgage History
| Date | Status | Borrower | Loan Amount |
|---|---|---|---|
| Open | Outhen Chamnan | $370,000 | |
| Previous Owner | Sieng Lily | $152,700 | |
| Previous Owner | Sieng Lily | $152,700 |
Source: Public Records
Tax History Compared to Growth
Tax History
| Year | Tax Paid | Tax Assessment Tax Assessment Total Assessment is a certain percentage of the fair market value that is determined by local assessors to be the total taxable value of land and additions on the property. | Land | Improvement |
|---|---|---|---|---|
| 2025 | $2,269 | $15,446 | -- | -- |
| 2024 | $1,972 | $14,711 | -- | -- |
| 2023 | $1,972 | $30,210 | $6,040 | $24,170 |
| 2022 | $1,932 | $22,410 | $4,480 | $17,930 |
| 2021 | $1,992 | $20,900 | $4,180 | $16,720 |
| 2020 | $1,967 | $18,560 | $3,710 | $14,850 |
| 2019 | $1,900 | $17,060 | $3,410 | $13,650 |
| 2018 | $1,846 | $16,980 | $3,390 | $13,590 |
| 2017 | $1,721 | $15,110 | $3,020 | $12,090 |
| 2016 | $1,632 | $14,060 | $2,810 | $11,250 |
| 2015 | $1,517 | $13,080 | $2,610 | $10,470 |
Source: Public Records
Map
Nearby Homes
- 2440 W Bloch Rd
- 2530 W Gaby Rd
- 2542 W Gaby Rd
- 5030 S 23rd Ave
- 5020 S 25th Ave Unit 2
- 4826 S 26th Ln
- 2536 W Grenadine Rd
- 2257 W Roeser Rd
- 5421 S 23rd Dr
- 2445 W La Salle St
- 2620 W Chanute Pass
- 2022 W Atlanta Ave
- 4602 S 19th Ave
- 2712 W Grenadine Rd
- 2032 W Pecan Rd
- 2417 W Sunland Ave
- 2019 W Wayland Rd
- 2434 W Hidalgo Ave
- 1813 W Tamarisk St
- 2430 W Hidalgo Ave