Estimated Value: $324,190 - $353,000
--
Bed
--
Bath
3,647
Sq Ft
$92/Sq Ft
Est. Value
About This Home
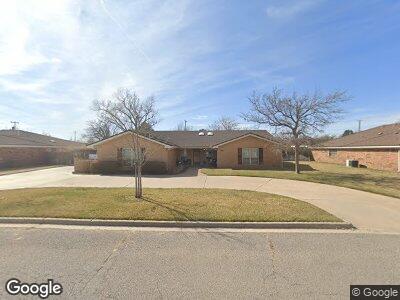
This home is located at 2329 Chestnut Dr, Pampa, TX 79065 and is currently estimated at $334,730, approximately $91 per square foot. 2329 Chestnut Dr is a home located in Gray County with nearby schools including Austin Elementary School, Pampa Junior High School, and Pampa High School.
Ownership History
Date
Name
Owned For
Owner Type
Purchase Details
Closed on
Sep 19, 2024
Sold by
Campbell Benjamin J and Campbell Mayra
Bought by
Baker Thomas L and Baker Carolyn Sue
Current Estimated Value
Purchase Details
Closed on
Dec 11, 2013
Sold by
Diann Kathryn Birdell Trust
Bought by
Campbell Benjamin J and Campbell Myra
Home Financials for this Owner
Home Financials are based on the most recent Mortgage that was taken out on this home.
Original Mortgage
$199,750
Interest Rate
4.14%
Mortgage Type
New Conventional
Purchase Details
Closed on
Mar 31, 2010
Sold by
Groomer Stephen and Groomer Jamie
Bought by
Campbell Benjamin J and Campbell Mayra C
Home Financials for this Owner
Home Financials are based on the most recent Mortgage that was taken out on this home.
Original Mortgage
$60,000
Interest Rate
4.96%
Create a Home Valuation Report for This Property
The Home Valuation Report is an in-depth analysis detailing your home's value as well as a comparison with similar homes in the area
Home Values in the Area
Average Home Value in this Area
Purchase History
| Date | Buyer | Sale Price | Title Company |
|---|---|---|---|
| Baker Thomas L | -- | Shelton Title | |
| Campbell Benjamin J | -- | Great Plains Abstract & Titl | |
| Campbell Benjamin J | -- | None Available |
Source: Public Records
Mortgage History
| Date | Status | Borrower | Loan Amount |
|---|---|---|---|
| Previous Owner | Campbell Benjamin J | $92,000 | |
| Previous Owner | Campbell Benjamin J | $65,000 | |
| Previous Owner | Campbell Benjamin J | $199,750 | |
| Previous Owner | Campbell Benjamin J | $60,000 |
Source: Public Records
Tax History Compared to Growth
Tax History
| Year | Tax Paid | Tax Assessment Tax Assessment Total Assessment is a certain percentage of the fair market value that is determined by local assessors to be the total taxable value of land and additions on the property. | Land | Improvement |
|---|---|---|---|---|
| 2024 | $7,470 | $287,300 | $17,200 | $270,100 |
| 2023 | $6,718 | $275,710 | $17,200 | $258,510 |
| 2022 | $6,132 | $234,020 | $17,200 | $216,820 |
| 2021 | $6,325 | $234,020 | $17,200 | $216,820 |
| 2020 | $6,292 | $234,020 | $17,200 | $216,820 |
| 2019 | $6,396 | $236,400 | $17,200 | $219,200 |
| 2018 | $6,349 | $236,400 | $17,200 | $219,200 |
| 2017 | $6,324 | $236,400 | $17,200 | $219,200 |
| 2016 | $6,139 | $240,570 | $17,200 | $223,370 |
| 2015 | -- | $245,830 | $17,200 | $228,630 |
| 2014 | -- | $248,460 | $17,200 | $231,260 |
Source: Public Records
Map
Nearby Homes
- 2318 N Beech Ln
- 2353 N Chestnut Dr
- 2310 N Aspen Dr
- 2304 N Dogwood Ln
- 2373 N Beech Ln
- 2223 N Chestnut Dr
- 2501 Beech Ln
- 2215 Beech Ln
- 2207 N Chestnut Dr
- 2421 Duncan St
- 2140 N Dogwood Ln
- 2234 Christine St
- 2320 N Cherokee Dr
- 2527 N Duncan St
- 2425 N Christine St
- 2115 N Chestnut Dr
- 1014 Quail Place
- 2225 N Mary-Ellen St
- 2412 Comanche Trail
- 1943 Grape Ln