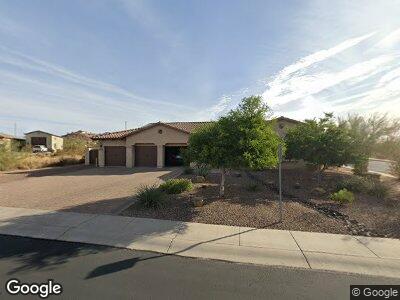
2335 N Woodruff Mesa, AZ 85207
Desert Uplands NeighborhoodEstimated Value: $1,105,161 - $1,524,000
--
Bed
1
Bath
3,913
Sq Ft
$335/Sq Ft
Est. Value
About This Home
This home is located at 2335 N Woodruff, Mesa, AZ 85207 and is currently estimated at $1,310,290, approximately $334 per square foot. 2335 N Woodruff is a home with nearby schools including Franklin at Brimhall Elementary School, Las Sendas Elementary School, and Franklin West Elementary School.
Ownership History
Date
Name
Owned For
Owner Type
Purchase Details
Closed on
Dec 10, 2012
Sold by
Blandford Homes Llc
Bought by
Bresson Robert and Bresson Tini
Current Estimated Value
Home Financials for this Owner
Home Financials are based on the most recent Mortgage that was taken out on this home.
Original Mortgage
$300,000
Outstanding Balance
$199,127
Interest Rate
2.12%
Mortgage Type
New Conventional
Estimated Equity
$1,111,163
Purchase Details
Closed on
Oct 19, 2012
Sold by
Pinnacle Ridge Holdings Llc
Bought by
Blandford Homes Llc
Home Financials for this Owner
Home Financials are based on the most recent Mortgage that was taken out on this home.
Original Mortgage
$300,000
Outstanding Balance
$199,127
Interest Rate
2.12%
Mortgage Type
New Conventional
Estimated Equity
$1,111,163
Purchase Details
Closed on
Jul 11, 2012
Sold by
Dqhermosa Llc
Bought by
Pinnacle Ridge Holdings Llc
Create a Home Valuation Report for This Property
The Home Valuation Report is an in-depth analysis detailing your home's value as well as a comparison with similar homes in the area
Home Values in the Area
Average Home Value in this Area
Purchase History
| Date | Buyer | Sale Price | Title Company |
|---|---|---|---|
| Bresson Robert | $509,326 | Old Republic Title Agency | |
| Blandford Homes Llc | -- | None Available | |
| Pinnacle Ridge Holdings Llc | $110,000 | Thomas Title & Escrow |
Source: Public Records
Mortgage History
| Date | Status | Borrower | Loan Amount |
|---|---|---|---|
| Open | Bresson Robert | $300,000 | |
| Closed | Pinnacle Ridge Holdings Llc | $0 |
Source: Public Records
Tax History Compared to Growth
Tax History
| Year | Tax Paid | Tax Assessment Tax Assessment Total Assessment is a certain percentage of the fair market value that is determined by local assessors to be the total taxable value of land and additions on the property. | Land | Improvement |
|---|---|---|---|---|
| 2025 | $5,439 | $61,524 | -- | -- |
| 2024 | $5,488 | $58,595 | -- | -- |
| 2023 | $5,488 | $84,020 | $16,800 | $67,220 |
| 2022 | $5,363 | $60,760 | $12,150 | $48,610 |
| 2021 | $5,435 | $56,010 | $11,200 | $44,810 |
| 2020 | $5,357 | $54,060 | $10,810 | $43,250 |
| 2019 | $4,965 | $55,220 | $11,040 | $44,180 |
| 2018 | $4,742 | $51,980 | $10,390 | $41,590 |
| 2017 | $4,582 | $54,830 | $10,960 | $43,870 |
| 2016 | $4,486 | $56,410 | $11,280 | $45,130 |
| 2015 | $4,180 | $53,630 | $10,720 | $42,910 |
Source: Public Records
Map
Nearby Homes
- 8446 E Laurel St
- 2224 N 83rd Cir
- 2330 N Channing
- 8322 E Kael St
- 8537 E Leland St
- 8525 E Lynwood St
- 8214 E Kael St
- 85XX E Culver St
- 8634 E Kael Cir
- 8040 E Laurel St
- 2116 N 81st Cir
- 2333 N 87th Place
- 2166 N Steele
- 2106 N Bridlewood
- 2304 N Steele Cir
- 8140 E June St
- 2237 N Calle Largo
- 8154 E Jaeger St
- 2357 N Steele Cir
- 2145 N 88th St