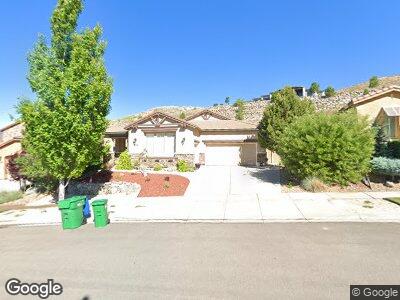
2335 Roanoke Trail Reno, NV 89523
Somersett NeighborhoodEstimated Value: $742,415 - $816,000
3
Beds
2
Baths
2,175
Sq Ft
$362/Sq Ft
Est. Value
About This Home
This home is located at 2335 Roanoke Trail, Reno, NV 89523 and is currently estimated at $786,854, approximately $361 per square foot. 2335 Roanoke Trail is a home located in Washoe County with nearby schools including B D Billinghurst Middle School and Robert McQueen High School.
Ownership History
Date
Name
Owned For
Owner Type
Purchase Details
Closed on
Nov 3, 2011
Sold by
Sara Marc Llc
Bought by
Fahami Terry and Terry Fahami Trust
Current Estimated Value
Purchase Details
Closed on
May 26, 2010
Sold by
Fahami Terry
Bought by
Marc Sara
Purchase Details
Closed on
May 17, 2010
Sold by
First Horizon Home Loans
Bought by
Fahami Terry and The Terry Fahami Trust
Purchase Details
Closed on
Oct 19, 2009
Sold by
Moyers Troy D
Bought by
First Horizon Home Loans
Purchase Details
Closed on
Dec 30, 2005
Sold by
Copper Knolls Llc
Bought by
Moyers Troy D
Home Financials for this Owner
Home Financials are based on the most recent Mortgage that was taken out on this home.
Original Mortgage
$375,300
Interest Rate
5.5%
Mortgage Type
Unknown
Purchase Details
Closed on
Dec 27, 2005
Sold by
Moyers Michelle M
Bought by
Moyers Troy D
Home Financials for this Owner
Home Financials are based on the most recent Mortgage that was taken out on this home.
Original Mortgage
$375,300
Interest Rate
5.5%
Mortgage Type
Unknown
Create a Home Valuation Report for This Property
The Home Valuation Report is an in-depth analysis detailing your home's value as well as a comparison with similar homes in the area
Home Values in the Area
Average Home Value in this Area
Purchase History
| Date | Buyer | Sale Price | Title Company |
|---|---|---|---|
| Fahami Terry | -- | None Available | |
| Marc Sara | -- | Direct Title Ins Agency In | |
| Fahami Terry | $240,000 | Direct Title Ins Agency In | |
| First Horizon Home Loans | $299,200 | None Available | |
| Moyers Troy D | $469,500 | Ticor Title Of Nevada Inc | |
| Moyers Troy D | -- | Ticor Title Of Nevada Inc |
Source: Public Records
Mortgage History
| Date | Status | Borrower | Loan Amount |
|---|---|---|---|
| Previous Owner | Moyers Troy D | $375,300 |
Source: Public Records
Tax History Compared to Growth
Tax History
| Year | Tax Paid | Tax Assessment Tax Assessment Total Assessment is a certain percentage of the fair market value that is determined by local assessors to be the total taxable value of land and additions on the property. | Land | Improvement |
|---|---|---|---|---|
| 2025 | $4,223 | $187,505 | $53,935 | $133,570 |
| 2024 | $4,100 | $182,102 | $47,565 | $134,537 |
| 2023 | $4,100 | $178,644 | $51,450 | $127,194 |
| 2022 | $3,981 | $151,542 | $45,570 | $105,972 |
| 2021 | $3,865 | $142,696 | $37,485 | $105,211 |
| 2020 | $3,751 | $139,292 | $34,020 | $105,272 |
| 2019 | $3,643 | $134,386 | $33,880 | $100,506 |
| 2018 | $3,537 | $126,942 | $28,560 | $98,382 |
| 2017 | $3,436 | $123,251 | $24,850 | $98,401 |
| 2016 | $3,348 | $123,656 | $23,170 | $100,486 |
| 2015 | $840 | $120,132 | $19,600 | $100,532 |
| 2014 | $3,239 | $102,704 | $16,660 | $86,044 |
| 2013 | -- | $85,741 | $15,505 | $70,236 |
Source: Public Records
Map
Nearby Homes
- 2385 Eagle Bend Trail
- 2370 Eagle Bend Trail
- 8673 Eagle Chase Trail Unit 444
- 8938 Beacon Ridge Trail
- 8956 Suncreek Trail
- 9093 Wild Skies Way
- 1980 Bechtol Ridge Cir
- 9110 Wild Skies Way
- 8665 Tom Kite Trail
- 1892 Laurel Ridge Dr
- 8120 Silver Strike Ct
- 8830 Scott Valley Ct
- 0 Apn 081-160-07 Unit 250002400
- 8195 Fox Meadows Ct Unit 376
- 1771 Fairway Hills Trail
- 8360 Cinnamon Ridge Ln
- 8175 Fox Meadows Ct Unit 375
- 1820 Scott Valley Rd
- 1845 Graysburg Dr
- 2225 Heavenly View Trail