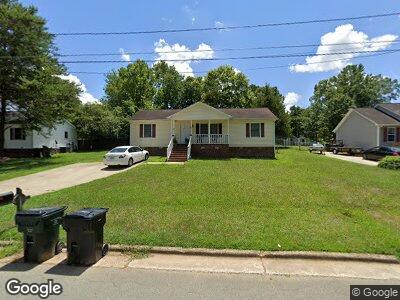
2345 Hillford Dr Burlington, NC 27217
East Burlington NeighborhoodEstimated Value: $218,899 - $239,000
3
Beds
2
Baths
1,152
Sq Ft
$198/Sq Ft
Est. Value
About This Home
This home is located at 2345 Hillford Dr, Burlington, NC 27217 and is currently estimated at $227,975, approximately $197 per square foot. 2345 Hillford Dr is a home located in Alamance County with nearby schools including R. Homer Andrews Elementary School, Broadview Middle School, and Hugh M. Cummings High School.
Ownership History
Date
Name
Owned For
Owner Type
Purchase Details
Closed on
Mar 31, 1993
Bought by
Clapp Vernon D
Current Estimated Value
Create a Home Valuation Report for This Property
The Home Valuation Report is an in-depth analysis detailing your home's value as well as a comparison with similar homes in the area
Home Values in the Area
Average Home Value in this Area
Purchase History
| Date | Buyer | Sale Price | Title Company |
|---|---|---|---|
| Clapp Vernon D | $11,000 | -- |
Source: Public Records
Mortgage History
| Date | Status | Borrower | Loan Amount |
|---|---|---|---|
| Open | Clapp Vernon D | $300,000 |
Source: Public Records
Tax History Compared to Growth
Tax History
| Year | Tax Paid | Tax Assessment Tax Assessment Total Assessment is a certain percentage of the fair market value that is determined by local assessors to be the total taxable value of land and additions on the property. | Land | Improvement |
|---|---|---|---|---|
| 2024 | $983 | $209,654 | $18,500 | $191,154 |
| 2023 | $1,910 | $209,654 | $18,500 | $191,154 |
| 2022 | $1,194 | $96,209 | $15,000 | $81,209 |
| 2021 | $1,204 | $96,209 | $15,000 | $81,209 |
| 2020 | $1,213 | $96,209 | $15,000 | $81,209 |
| 2019 | $1,216 | $96,209 | $15,000 | $81,209 |
| 2018 | $572 | $96,209 | $15,000 | $81,209 |
| 2017 | $1,133 | $96,209 | $15,000 | $81,209 |
| 2016 | $1,167 | $100,598 | $20,000 | $80,598 |
| 2015 | $581 | $100,598 | $20,000 | $80,598 |
| 2014 | -- | $100,598 | $20,000 | $80,598 |
Source: Public Records
Map
Nearby Homes
- 2241 Wilkins St
- 2001 S Ashland Dr
- 2503 Mckinney St
- 2509 Mckinney St
- 438 Hyde St
- 324 Dare St
- 229 Watson Dr
- 639 Woodhaven Dr
- Tbd New Jersey Ave
- 0 New Jersey Ave
- 0 Knollwood Dr
- 1405 N Sellars Mill Rd
- 2923 Mckinney St
- 622 Bentley Ln
- 1509 Vaughn Rd
- 1737 Hedge St
- 208 N Beaumont Ave
- 709 S Sellars Mill Rd
- 1436 Lanier Ct
- 204 S Beaumont Ave