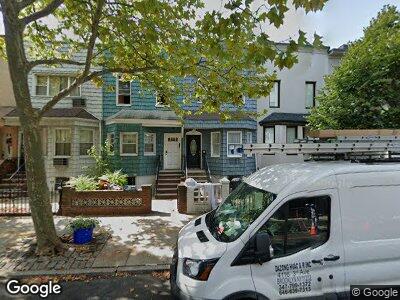
239 Monitor St Brooklyn, NY 11222
Greenpoint NeighborhoodEstimated Value: $1,586,000 - $1,798,000
4
Beds
3
Baths
1,123
Sq Ft
$1,499/Sq Ft
Est. Value
About This Home
This home is located at 239 Monitor St, Brooklyn, NY 11222 and is currently estimated at $1,683,318, approximately $1,498 per square foot. 239 Monitor St is a home located in Kings County with nearby schools including P.S. 110 - The Monitor School, Northside Charter High School, and St. Stanislaus Kostka Catholic Academy.
Ownership History
Date
Name
Owned For
Owner Type
Purchase Details
Closed on
May 11, 2021
Sold by
239 Monitor Street Llc
Bought by
Demetz Clement and Demetz Sarah
Current Estimated Value
Home Financials for this Owner
Home Financials are based on the most recent Mortgage that was taken out on this home.
Original Mortgage
$1,125,000
Outstanding Balance
$1,033,172
Interest Rate
3%
Mortgage Type
Purchase Money Mortgage
Estimated Equity
$650,702
Purchase Details
Closed on
Mar 4, 2015
Sold by
Achaia Helene
Bought by
239 Monitor Street Llc
Home Financials for this Owner
Home Financials are based on the most recent Mortgage that was taken out on this home.
Original Mortgage
$690,000
Interest Rate
3.6%
Mortgage Type
Purchase Money Mortgage
Purchase Details
Closed on
Nov 13, 1995
Sold by
Green John
Bought by
Achaia Rayman and Achaia Helene
Create a Home Valuation Report for This Property
The Home Valuation Report is an in-depth analysis detailing your home's value as well as a comparison with similar homes in the area
Home Values in the Area
Average Home Value in this Area
Purchase History
| Date | Buyer | Sale Price | Title Company |
|---|---|---|---|
| Demetz Clement | $1,450,000 | -- | |
| 239 Monitor Street Llc | $920,000 | -- | |
| Achaia Rayman | $145,000 | -- |
Source: Public Records
Mortgage History
| Date | Status | Borrower | Loan Amount |
|---|---|---|---|
| Open | Demetz Clement | $1,125,000 | |
| Previous Owner | 239 Monitor Street Llc | $690,000 | |
| Previous Owner | Achaia Helene | $237,586 | |
| Previous Owner | Achaia Helene | $265,000 | |
| Previous Owner | Achaia Helene | $180,000 |
Source: Public Records
Tax History Compared to Growth
Tax History
| Year | Tax Paid | Tax Assessment Tax Assessment Total Assessment is a certain percentage of the fair market value that is determined by local assessors to be the total taxable value of land and additions on the property. | Land | Improvement |
|---|---|---|---|---|
| 2024 | $3,972 | $94,740 | $13,620 | $81,120 |
| 2023 | $3,842 | $98,340 | $13,620 | $84,720 |
| 2022 | $3,604 | $79,200 | $13,620 | $65,580 |
| 2021 | $3,799 | $73,620 | $13,620 | $60,000 |
| 2020 | $912 | $74,460 | $13,620 | $60,840 |
| 2019 | $3,447 | $70,080 | $13,620 | $56,460 |
| 2018 | $3,213 | $15,763 | $2,286 | $13,477 |
| 2017 | $3,067 | $15,045 | $3,443 | $11,602 |
| 2016 | $3,008 | $15,045 | $3,368 | $11,677 |
| 2015 | $1,492 | $14,529 | $4,875 | $9,654 |
| 2014 | $1,492 | $13,732 | $5,022 | $8,710 |
Source: Public Records
Map
Nearby Homes
- 235 N Henry St Unit 3
- 231 Norman Ave Unit 502
- 231 Norman Ave Unit 214
- 198 Monitor St Unit 3
- 221 Nassau Ave
- 171 Monitor St
- 275 Nassau Ave
- 40A Jewel St
- 75 Sutton St
- 278 Nassau Ave Unit 3B
- 278 Nassau Ave Unit 3A
- 232 Kingsland Ave
- 93 Jewel St
- 146 Diamond St
- 161A Diamond St
- 146 Newel St
- 19 Hausman St Unit 2 B
- 101 Monitor St
- 14 Hausman St
- 183 Kingsland Ave Unit 3