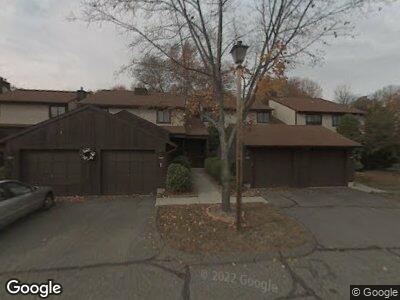
2402 Mill Pond Dr South Windsor, CT 06074
Estimated Value: $390,000 - $426,000
2
Beds
3
Baths
1,749
Sq Ft
$235/Sq Ft
Est. Value
About This Home
This home is located at 2402 Mill Pond Dr, South Windsor, CT 06074 and is currently estimated at $410,430, approximately $234 per square foot. 2402 Mill Pond Dr is a home located in Hartford County with nearby schools including Timothy Edwards School and South Windsor High School.
Ownership History
Date
Name
Owned For
Owner Type
Purchase Details
Closed on
Feb 24, 2012
Sold by
Apter Philip P
Bought by
Apter Philip P and Apter Geraldine
Current Estimated Value
Purchase Details
Closed on
Mar 24, 2004
Sold by
Penick Joel
Bought by
Apter Philip Peter
Home Financials for this Owner
Home Financials are based on the most recent Mortgage that was taken out on this home.
Original Mortgage
$120,000
Interest Rate
5.65%
Purchase Details
Closed on
Oct 2, 1996
Sold by
Dressler Jeffrey
Bought by
Roman Jorge
Home Financials for this Owner
Home Financials are based on the most recent Mortgage that was taken out on this home.
Original Mortgage
$83,000
Interest Rate
7.9%
Mortgage Type
Unknown
Purchase Details
Closed on
Apr 26, 1991
Sold by
Midconn Bank
Bought by
Valente Lillian
Home Financials for this Owner
Home Financials are based on the most recent Mortgage that was taken out on this home.
Original Mortgage
$101,200
Interest Rate
6.88%
Mortgage Type
Unknown
Create a Home Valuation Report for This Property
The Home Valuation Report is an in-depth analysis detailing your home's value as well as a comparison with similar homes in the area
Home Values in the Area
Average Home Value in this Area
Purchase History
| Date | Buyer | Sale Price | Title Company |
|---|---|---|---|
| Apter Philip P | -- | -- | |
| Apter Philip Peter | $194,900 | -- | |
| Roman Jorge | $85,000 | -- | |
| Valente Lillian | $126,500 | -- |
Source: Public Records
Mortgage History
| Date | Status | Borrower | Loan Amount |
|---|---|---|---|
| Previous Owner | Valente Lillian | $120,000 | |
| Previous Owner | Valente Lillian | $101,823 | |
| Previous Owner | Valente Lillian | $83,000 | |
| Previous Owner | Valente Lillian | $101,200 | |
| Closed | Valente Lillian | $3,100 |
Source: Public Records
Tax History Compared to Growth
Tax History
| Year | Tax Paid | Tax Assessment Tax Assessment Total Assessment is a certain percentage of the fair market value that is determined by local assessors to be the total taxable value of land and additions on the property. | Land | Improvement |
|---|---|---|---|---|
| 2024 | $6,916 | $200,700 | $0 | $200,700 |
| 2023 | $6,651 | $200,700 | $0 | $200,700 |
| 2022 | $4,920 | $126,900 | $0 | $126,900 |
| 2021 | $4,804 | $126,900 | $0 | $126,900 |
| 2020 | $4,807 | $126,900 | $0 | $126,900 |
| 2019 | $4,886 | $126,900 | $0 | $126,900 |
| 2018 | $4,780 | $126,900 | $0 | $126,900 |
| 2017 | $4,988 | $131,000 | $0 | $131,000 |
| 2016 | $4,892 | $131,000 | $0 | $131,000 |
| 2015 | $4,787 | $131,000 | $0 | $131,000 |
| 2014 | $4,652 | $131,000 | $0 | $131,000 |
Source: Public Records
Map
Nearby Homes
- 1305 Mill Pond Dr
- 512 Twin Circle Dr Unit 512
- 64 Candlewood Dr Unit 64
- 148 Quarry Brook Dr
- 461 Quarry Brook Dr
- 1072 Ellington Rd
- 21 Quarry Brook Dr
- 7 Arrowwood Cir Unit 7
- 960 Pleasant Valley Rd
- 205 Pleasant Valley Condo Unit 205
- 949 Pleasant Valley Rd Unit 8-8
- 949 Pleasant Valley Rd Unit 11-8
- 949 Pleasant Valley Rd Unit 6-3
- 550 Governors Hwy
- 202 Garden Cir Unit 202
- 61 Ronda Dr
- 70 Jacques Ln
- 20 Amato Dr Unit G
- 105 Gail Ln
- 185 Lefoll Blvd