$488,000 - $572,000
RENTED MAY 10, 2024

2403 Sheraton St Silver Spring, MD 20906

5 Beds
3 Baths
1,430 Sq Ft
$370 Price per Sq Ft

Last Sold March 29, 2024

Last sale price $555,000 $388 Per Sq Ft

Est. 5% decrease in value since last sale

Current estimated payment $3,334/month

About This Home

As of March 2024

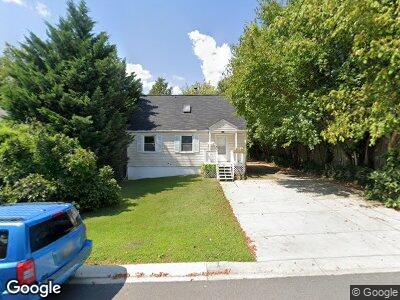
BEAUTIFUL! REMODELED! FIVE BEDROOMS, 3 FULL BATHS, EVERYTHING UPDATED, GREAT LOCATION, CLOSE TO METRO. Photos will be published soon.

Ownership History

Date Name Owned For Owner Type

Purchase Details

Listed on
Apr 19, 2024
Closed on
Mar 29, 2024
Sold by
Kayl Christopher C
Bought by
Shaheen Mahmood
Seller's Agent
Neville Halstead
Compass
Buyer's Agent
Neville Halstead
Compass
Sold Price
$2,800
Views
200
Current Estimated Value
$529,099

Home Financials for this Owner

Home Financials are based on the most recent Mortgage that was taken out on this home.
Estimated Appreciation
$526,299
Avg. Annual Appreciation
-4.37%

Purchase Details

Closed on
Dec 1, 2005
Sold by
Greene Kathy Jo
Bought by
Kayl Christopher C

Purchase Details

Closed on
Sep 8, 2005
Sold by
Greene Kathy Jo
Bought by
Kayl Christopher C

Purchase Details

Closed on
Oct 6, 2003
Sold by
Abreu Leonard M
Bought by
Greene Kathy Jo

Purchase Details

Closed on
Oct 12, 2000
Sold by
Vanlowe William T and Vanlowe I E
Bought by
Abrew Leonard M

Range of Values:

Collateral Analytics

Collateral Analytics Collateral Analytics AVMs (Automated Valuation Model) employ a number of statistical approaches combined with neighborhood-specific comparable selection guarantees the most up-to-date and precise valuations.

Not Available

Collateral Analytics does not have data for the current month. Please view the chart for historical values.

ICE

ICE Mortgage Technology ICE Mortgage Technology’s AVM (Automated Valuation Model) is a state-of-the-art online residential property valuation tool that provides a quick and accurate estimate of the value of almost any home in the U.S.

Not Available

ICE Mortgage Technology does not have data for the current month. Please view the chart for historical values.

First American

First American First American Data & Analytics’ next-generation AVM combines unrivaled data assets with a blended ensemble of valuation models to produce highly accurate, reliable valuations you can trust.

Not Available

First American does not have data for the current month. Please view the chart for historical values.

Quantarium

Quantarium Quantarium’s valuation service, repeatedly proven the industry’s most accurate and comprehensive, is supercharged with a self-learning and auto-tuning AI engine that continually becomes smarter and more accurate as it processes daily inputs from the industry’s leading RE data lake.

Not Available

Quantarium does not have data for the current month. Please view the chart for historical values.

Average Value
Not Available
List Price
Sold Price
Create a Home Valuation Report for This Property
The Home Valuation Report is an in-depth analysis detailing your home's value as well as a comparison with similar homes in the area

Home Values in the Area

Source: Public Records

Average Home Value in this Area


Source: Public Records

Purchase History

Date Buyer Sale Price Title Company
Shaheen Mahmood $555,000 Rgs Title
Kayl Christopher C $390,000 --
Greene Kathy Jo $260,000 --
Abrew Leonard M $128,000 --
Source: Public Records

Property History

Date Event Price Change Sq Ft Price
05/10/2024 05/10/24 Rented $2,800 0.0% --
05/06/2024 05/06/24 Under Contract -- -- --
04/19/2024 04/19/24 For Rent $2,800 0.0% --
03/29/2024 03/29/24 Sold $555,000 +11.0% $388 / Sq Ft
03/11/2024 03/11/24 Pending -- -- --
03/06/2024 03/06/24 For Sale $500,000 -- $350 / Sq Ft

Tax History Compared to Growth

Source: Public Records

Tax History

Year Tax Paid Tax Assessment Tax Assessment Total Assessment is a certain percentage of the fair market value that is determined by local assessors to be the total taxable value of land and additions on the property. Land Improvement
2024 $4,569 $333,367 $0 $0
2023 $0 $311,133 $0 $0
2022 $3,841 $288,900 $163,700 $125,200
2021 $3,613 $283,100 $0 $0
2020 $3,613 $277,300 $0 $0
2019 $3,515 $271,500 $163,700 $107,800
2018 $3,478 $270,533 $0 $0
2017 $3,510 $269,567 $0 $0
2016 -- $268,600 $0 $0
2015 $2,960 $257,400 $0 $0
2014 $2,960 $246,200 $0 $0
Source: Public Records

Agents Affiliated with this Home

  • Section Image
  • Section Image
See All Agents

Map