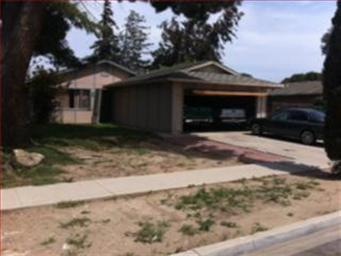

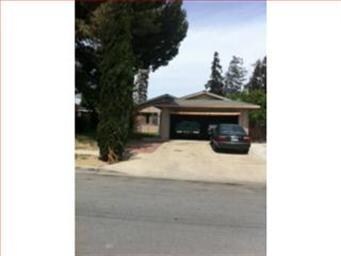
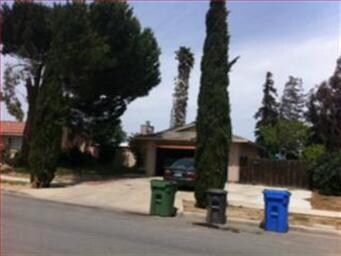
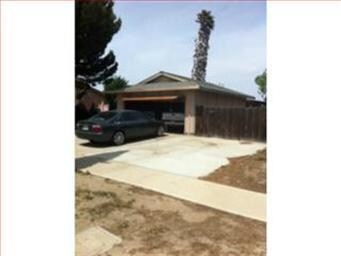
244 San Antonio Dr Greenfield, CA 93927
Highlights
- Primary Bedroom Suite
- Bathtub with Shower
- Forced Air Heating System
- Breakfast Area or Nook
- Walk-in Shower
- Vinyl Flooring
About This Home
As of August 2021Great opportunity for a First Time Homebuyer. Located in a nice neighborhood, walking distance to school, this home has lots of potential and priced right to make your total payment less than what you are paying to rent! With a little TLC, this home can be a wonderful place to live. Won't last long!
Last Agent to Sell the Property
Bruce Pierson
Pierson Realty Group License #00515968
Last Buyer's Agent
Bruce Pierson
Pierson Realty Group License #00515968
Home Details
Home Type
- Single Family
Est. Annual Taxes
- $6,027
Year Built
- Built in 1980
Parking
- 2 Car Garage
Home Design
- Slab Foundation
- Composition Roof
Interior Spaces
- 1,120 Sq Ft Home
- 1-Story Property
- Vinyl Flooring
Kitchen
- Breakfast Area or Nook
- Built-In Oven
- Dishwasher
- Disposal
Bedrooms and Bathrooms
- 3 Bedrooms
- Primary Bedroom Suite
- 2 Full Bathrooms
- Bathtub with Shower
- Walk-in Shower
Utilities
- Forced Air Heating System
- Sewer Within 50 Feet
Listing and Financial Details
- Assessor Parcel Number 109-512-024
Map
Home Values in the Area
Average Home Value in this Area
Property History
| Date | Event | Price | Change | Sq Ft Price |
|---|---|---|---|---|
| 08/31/2021 08/31/21 | Sold | $485,000 | +5.7% | $433 / Sq Ft |
| 08/05/2021 08/05/21 | Pending | -- | -- | -- |
| 07/29/2021 07/29/21 | For Sale | $459,000 | +141.6% | $410 / Sq Ft |
| 08/26/2016 08/26/16 | Sold | $190,000 | -9.5% | $170 / Sq Ft |
| 08/18/2016 08/18/16 | Pending | -- | -- | -- |
| 07/31/2016 07/31/16 | For Sale | $210,000 | +101.9% | $188 / Sq Ft |
| 09/25/2012 09/25/12 | Sold | $104,000 | -6.3% | $93 / Sq Ft |
| 05/26/2012 05/26/12 | Pending | -- | -- | -- |
| 05/13/2012 05/13/12 | For Sale | $111,000 | -- | $99 / Sq Ft |
Tax History
| Year | Tax Paid | Tax Assessment Tax Assessment Total Assessment is a certain percentage of the fair market value that is determined by local assessors to be the total taxable value of land and additions on the property. | Land | Improvement |
|---|---|---|---|---|
| 2024 | $6,027 | $504,594 | $249,696 | $254,898 |
| 2023 | $6,286 | $494,700 | $244,800 | $249,900 |
| 2022 | $6,050 | $485,000 | $240,000 | $245,000 |
| 2021 | $3,833 | $485,000 | $240,000 | $245,000 |
| 2020 | $3,995 | $312,120 | $124,848 | $187,272 |
| 2019 | $3,898 | $306,000 | $122,400 | $183,600 |
| 2018 | $3,797 | $300,000 | $120,000 | $180,000 |
| 2017 | $2,445 | $190,000 | $100,000 | $90,000 |
| 2016 | $1,485 | $108,182 | $52,011 | $56,171 |
| 2015 | $1,350 | $106,558 | $51,230 | $55,328 |
| 2014 | $1,322 | $104,472 | $50,227 | $54,245 |
Mortgage History
| Date | Status | Loan Amount | Loan Type |
|---|---|---|---|
| Open | $463,980 | FHA | |
| Previous Owner | $292,000 | New Conventional | |
| Previous Owner | $294,566 | FHA | |
| Previous Owner | $78,000 | New Conventional | |
| Previous Owner | $280,000 | Negative Amortization | |
| Previous Owner | $240,000 | Stand Alone Refi Refinance Of Original Loan | |
| Previous Owner | $135,000 | Stand Alone First | |
| Previous Owner | $131,250 | Stand Alone First | |
| Previous Owner | $30,000 | Credit Line Revolving | |
| Previous Owner | $88,140 | Stand Alone First |
Deed History
| Date | Type | Sale Price | Title Company |
|---|---|---|---|
| Grant Deed | $485,000 | Old Republic Title Company | |
| Grant Deed | $300,000 | Chicago Title Company | |
| Grant Deed | $190,000 | Old Republic Title Company | |
| Grant Deed | $104,000 | Chicago Title Company | |
| Interfamily Deed Transfer | -- | Multiple | |
| Grant Deed | -- | Stewart Title | |
| Quit Claim Deed | -- | -- |
Source: MLSListings
MLS Number: ML81217925
APN: 109-512-024-000
Disclaimer: Certain information contained herein is derived from information provided by parties other than Homes.com. All information provided is deemed reliable, but is not guaranteed to be accurate and should be independently verified.
![]() Property Information © 2025 MLSListings Inc. All rights reserved. Listing information is deemed reliable but not guaranteed. Certain information contained herein is derived from information which is the licensed property of, and copyrighted by, MLSListings Inc. The viewer acknowledges ownership and validity of its copyright. Information provided is for personal, non-commercial use by a viewer with a bona fide interest in the purchase or sale of real estate of the type being offered via this website or other electronic means. The viewer is prohibited from copying, redistributing or retransmitting any of the data or information provided by MLSListing, Inc.
Property Information © 2025 MLSListings Inc. All rights reserved. Listing information is deemed reliable but not guaranteed. Certain information contained herein is derived from information which is the licensed property of, and copyrighted by, MLSListings Inc. The viewer acknowledges ownership and validity of its copyright. Information provided is for personal, non-commercial use by a viewer with a bona fide interest in the purchase or sale of real estate of the type being offered via this website or other electronic means. The viewer is prohibited from copying, redistributing or retransmitting any of the data or information provided by MLSListing, Inc.
- 1256 Morris Ave
- 1227 Apple Ave
- 1294 Oak Ave
- 325 Meadow Cir
- 324 Hutchison Dr
- 325 11th St
- 247 10th St
- 405 Primavera Ct
- 0 Elm Ave
- 717 Oak Ave
- 12 Huerta St
- 639 Saint Christopher Ln
- 42050 El Camino Real
- 701 El Camino Real
- 41725 Walnut Ave
- 44030 Leslie Ln
- 35700 Eagle Ridge
- 36176 Mile End Rd
- 34120 Fabry Rd
- 1734 Vosti Ave