J
Seller's Agent in 2023
Jamie Walker
Olde Towne Realty
(413) 525-8304
1 in this area
31 Total Sales
Estimated Value: $896,000 - $1,153,133
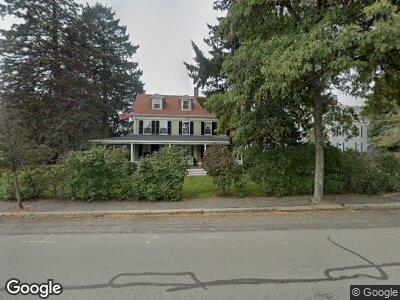
This home is located at 245 Humphrey St, Marblehead, MA 01945 and is currently estimated at $1,058,783, approximately $352 per square foot. 245 Humphrey St is a home located in Essex County with nearby schools including Marblehead High School, Devereux School, and Tower School.
| Date | Buyer | Sale Price | Title Company |
|---|---|---|---|
| Walker Ft | -- | None Available | |
| Walker Ft | -- | None Available | |
| Tilton Jonathan R | -- | -- | |
| Tilton Jonathan R | -- | -- | |
| Tilton Jonathan R | -- | -- |
| Date | Status | Borrower | Loan Amount |
|---|---|---|---|
| Open | Georgia Koumoundouros T | $625,000 | |
| Closed | Georgia Koumoundouros T | $625,000 | |
| Previous Owner | Tilton Jonathan R | $16,000 | |
| Previous Owner | Tilton Jonathan R | $107,400 |
| Date | Event | Price | Change | Sq Ft Price |
|---|---|---|---|---|
| 12/01/2023 12/01/23 | Rented | $11,750 | 0.0% | -- |
| 12/01/2023 12/01/23 | Under Contract | -- | -- | -- |
| 12/01/2023 12/01/23 | For Rent | $11,750 | 0.0% | -- |
| 11/15/2023 11/15/23 | Sold | $975,000 | -11.4% | $325 / Sq Ft |
| 09/25/2023 09/25/23 | Pending | -- | -- | -- |
| 09/19/2023 09/19/23 | For Sale | $1,100,000 | -- | $367 / Sq Ft |
| Year | Tax Paid | Tax Assessment Tax Assessment Total Assessment is a certain percentage of the fair market value that is determined by local assessors to be the total taxable value of land and additions on the property. | Land | Improvement |
|---|---|---|---|---|
| 2025 | $8,686 | $959,800 | $618,900 | $340,900 |
| 2024 | $8,331 | $929,800 | $557,000 | $372,800 |
| 2023 | $8,530 | $853,000 | $557,000 | $296,000 |
| 2022 | $7,926 | $753,400 | $464,200 | $289,200 |
| 2021 | $7,479 | $717,800 | $433,200 | $284,600 |
| 2020 | $7,664 | $737,600 | $464,200 | $273,400 |
| 2019 | $7,466 | $695,200 | $433,200 | $262,000 |
| 2018 | $7,150 | $648,800 | $386,800 | $262,000 |
| 2017 | $6,462 | $586,900 | $324,900 | $262,000 |
| 2016 | $6,172 | $556,000 | $294,000 | $262,000 |
| 2015 | $6,332 | $571,500 | $309,500 | $262,000 |
| 2014 | $5,850 | $527,500 | $278,500 | $249,000 |
J
Seller's Agent in 2023
Jamie Walker
Olde Towne Realty
(413) 525-8304
1 in this area
31 Total Sales
P
Seller's Agent in 2023
Philip Goduti
Walker Thomas LLC
(508) 826-0749
C
Buyer's Agent in 2023
Caitlan Williams
William Raveis R.E. & Home Services
(617) 797-4707
