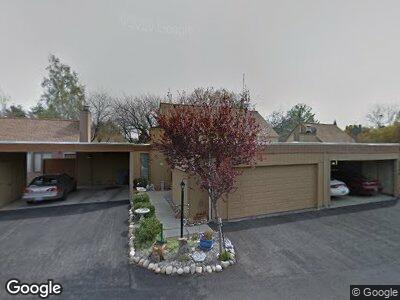
2462 Mullet Ct Richland, WA 99354
Clipper Ridge NeighborhoodEstimated Value: $280,368 - $309,000
3
Beds
2
Baths
1,442
Sq Ft
$206/Sq Ft
Est. Value
About This Home
This home is located at 2462 Mullet Ct, Richland, WA 99354 and is currently estimated at $297,592, approximately $206 per square foot. 2462 Mullet Ct is a home located in Benton County with nearby schools including Sacajawea Elementary School, Chief Joseph Middle School, and Hanford High School.
Ownership History
Date
Name
Owned For
Owner Type
Purchase Details
Closed on
Oct 23, 2008
Sold by
Willis Kelly J
Bought by
Chesney Diane M
Current Estimated Value
Home Financials for this Owner
Home Financials are based on the most recent Mortgage that was taken out on this home.
Original Mortgage
$124,135
Interest Rate
5.77%
Mortgage Type
FHA
Purchase Details
Closed on
Jul 25, 2008
Sold by
Willis Kevin P
Bought by
Willis Kelly J
Purchase Details
Closed on
Mar 26, 2008
Sold by
Willis Kerry L
Bought by
Willis Kelly J
Purchase Details
Closed on
Dec 10, 2007
Sold by
Mcvicker Roger A and Mcvicker Mary Lou
Bought by
Willis Ruby J
Home Financials for this Owner
Home Financials are based on the most recent Mortgage that was taken out on this home.
Original Mortgage
$101,360
Interest Rate
6.21%
Mortgage Type
Purchase Money Mortgage
Purchase Details
Closed on
May 3, 2005
Sold by
Gouthia Latrisha
Bought by
Mcvicker Roger A and Mcvicker Mary Lou
Create a Home Valuation Report for This Property
The Home Valuation Report is an in-depth analysis detailing your home's value as well as a comparison with similar homes in the area
Home Values in the Area
Average Home Value in this Area
Purchase History
| Date | Buyer | Sale Price | Title Company |
|---|---|---|---|
| Chesney Diane M | $126,000 | Benton Franklin Title Co | |
| Willis Kelly J | -- | Marshall Title Co | |
| Willis Kelly J | -- | Marshall Title Co | |
| Willis Ruby J | $126,700 | Cascade Title | |
| Mcvicker Roger A | $120,000 | Chicago Title |
Source: Public Records
Mortgage History
| Date | Status | Borrower | Loan Amount |
|---|---|---|---|
| Open | Chesney Diane M | $174,000 | |
| Closed | Chesney Daine M | $135,000 | |
| Closed | Chesney Diane M | $118,011 | |
| Closed | Chesney Diane M | $124,135 | |
| Previous Owner | Willis Ruby J | $101,360 |
Source: Public Records
Tax History Compared to Growth
Tax History
| Year | Tax Paid | Tax Assessment Tax Assessment Total Assessment is a certain percentage of the fair market value that is determined by local assessors to be the total taxable value of land and additions on the property. | Land | Improvement |
|---|---|---|---|---|
| 2024 | $2,641 | $287,320 | $40,000 | $247,320 |
| 2023 | $2,641 | $280,980 | $40,000 | $240,980 |
| 2022 | $2,411 | $242,930 | $40,000 | $202,930 |
| 2021 | $1,656 | $217,560 | $40,000 | $177,560 |
| 2020 | $1,869 | $144,580 | $40,000 | $104,580 |
| 2019 | $1,285 | $153,190 | $0 | $153,190 |
| 2018 | $1,534 | $113,470 | $0 | $113,470 |
| 2017 | $1,355 | $113,470 | $0 | $113,470 |
| 2016 | $1,335 | $113,470 | $0 | $113,470 |
| 2015 | $1,360 | $113,470 | $0 | $113,470 |
| 2014 | -- | $113,470 | $0 | $113,470 |
| 2013 | -- | $113,470 | $0 | $113,470 |
Source: Public Records
Map
Nearby Homes
- 331 Westmoreland Dr
- 406 Shoreline Ct
- 353 Driftwood Ct
- 2390 Carriage Ave
- 560 Spengler St Unit M
- 2534 Cordoba Ct
- 42 Mercury Dr
- 2317 Hood Ave
- 59 Proton Ln
- 17 Galaxy Ln
- 28 Proton Ln
- 32 Nuclear Ln
- 53 Cosmic Ln
- 50 Compton Ln
- 50 Compton Ln Unit 51
- 660 Cherrywood Loop
- 49 Compton Ln
- 401 Shaw St
- 532 Franklin St
- 541 Franklin St