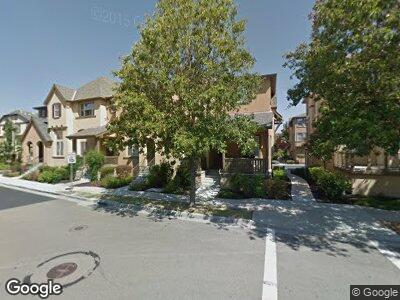
2468 Millstream Ln Unit 145 San Ramon, CA 94582
Gale Ranch-Windemere NeighborhoodEstimated Value: $1,077,000 - $1,208,000
3
Beds
3
Baths
1,979
Sq Ft
$588/Sq Ft
Est. Value
About This Home
This home is located at 2468 Millstream Ln Unit 145, San Ramon, CA 94582 and is currently estimated at $1,164,425, approximately $588 per square foot. 2468 Millstream Ln Unit 145 is a home located in Contra Costa County with nearby schools including Bella Vista Elementary School, Windemere Ranch Middle School, and Dougherty Valley High School.
Ownership History
Date
Name
Owned For
Owner Type
Purchase Details
Closed on
Jul 9, 2012
Sold by
Patil Shilpa
Bought by
Patil Vijaysinha
Current Estimated Value
Home Financials for this Owner
Home Financials are based on the most recent Mortgage that was taken out on this home.
Original Mortgage
$414,000
Outstanding Balance
$293,337
Interest Rate
3.63%
Mortgage Type
New Conventional
Estimated Equity
$856,744
Purchase Details
Closed on
Apr 4, 2005
Sold by
Brookfield Ambridge Llc
Bought by
Sandhu Javed I and Ghafoor Sadia
Home Financials for this Owner
Home Financials are based on the most recent Mortgage that was taken out on this home.
Original Mortgage
$535,869
Interest Rate
5.5%
Mortgage Type
Purchase Money Mortgage
Create a Home Valuation Report for This Property
The Home Valuation Report is an in-depth analysis detailing your home's value as well as a comparison with similar homes in the area
Home Values in the Area
Average Home Value in this Area
Purchase History
| Date | Buyer | Sale Price | Title Company |
|---|---|---|---|
| Patil Vijaysinha | -- | None Available | |
| Patil Vijaysinha | $470,000 | None Available | |
| Sandhu Javed I | $670,000 | First American Title |
Source: Public Records
Mortgage History
| Date | Status | Borrower | Loan Amount |
|---|---|---|---|
| Open | Patil Vijaysinha | $105,500 | |
| Open | Patil Vijaysinha | $414,000 | |
| Previous Owner | Sandhu Javed I | $100,000 | |
| Previous Owner | Sandhu Javed I | $576,000 | |
| Previous Owner | Sandhu Javed I | $535,869 | |
| Closed | Sandhu Javed I | $100,475 |
Source: Public Records
Tax History Compared to Growth
Tax History
| Year | Tax Paid | Tax Assessment Tax Assessment Total Assessment is a certain percentage of the fair market value that is determined by local assessors to be the total taxable value of land and additions on the property. | Land | Improvement |
|---|---|---|---|---|
| 2024 | $9,798 | $567,411 | $296,986 | $270,425 |
| 2023 | $9,798 | $556,286 | $291,163 | $265,123 |
| 2022 | $9,635 | $545,379 | $285,454 | $259,925 |
| 2021 | $9,396 | $534,686 | $279,857 | $254,829 |
| 2019 | $9,141 | $518,829 | $271,557 | $247,272 |
| 2018 | $8,866 | $508,657 | $266,233 | $242,424 |
| 2017 | $8,729 | $498,684 | $261,013 | $237,671 |
| 2016 | $8,629 | $488,907 | $255,896 | $233,011 |
| 2015 | $8,496 | $481,564 | $252,053 | $229,511 |
| 2014 | $8,403 | $472,132 | $247,116 | $225,016 |
Source: Public Records
Map
Nearby Homes
- 2161 Watermill Rd
- 2165 Watermill Rd Unit 54
- 411 Joree Ln Unit 22
- 1032 S Monarch Rd
- 5027 Barrenstar Way
- 1732 Blakesley Dr
- 5041 Barrenstar Way
- 5131 Rowan Dr
- 2019 Tarragon Rose Ct
- 6256 Main Branch Rd
- 6052 Alpine Blue Dr
- 3026 Sonsilla Ln
- 2037 Poinsettia St
- 624 Dromana Ct
- 2258 S Donovan Way
- 2605 Casella Way
- 2323 Maidenhair Way
- 3100 Tewksbury Way
- 1650 Banbury Dr
- 2472 Basswood Dr