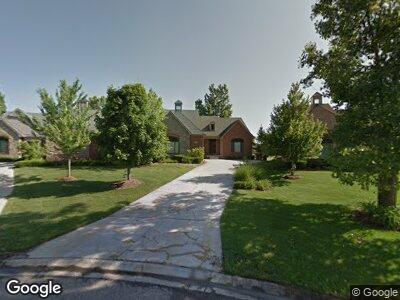
2478 Winged Foot Ct Unit 5 Ann Arbor, MI 48108
Stonebridge NeighborhoodEstimated Value: $799,617 - $890,000
4
Beds
4
Baths
3,220
Sq Ft
$257/Sq Ft
Est. Value
About This Home
This home is located at 2478 Winged Foot Ct Unit 5, Ann Arbor, MI 48108 and is currently estimated at $828,154, approximately $257 per square foot. 2478 Winged Foot Ct Unit 5 is a home located in Washtenaw County with nearby schools including Heritage School, Harvest Elementary School, and Saline Middle School.
Ownership History
Date
Name
Owned For
Owner Type
Purchase Details
Closed on
Jun 16, 2009
Sold by
Armstrong Kenneth H and Armstrong Virginia M
Bought by
Furlow Richard and Furlow Sarah
Current Estimated Value
Home Financials for this Owner
Home Financials are based on the most recent Mortgage that was taken out on this home.
Original Mortgage
$263,000
Interest Rate
4.92%
Purchase Details
Closed on
Apr 30, 2007
Sold by
Martin Jeffrey B and Martin Catherine A
Bought by
Armstrong Kenneth H and Armstrong Virginia M
Home Financials for this Owner
Home Financials are based on the most recent Mortgage that was taken out on this home.
Original Mortgage
$417,000
Interest Rate
6.2%
Create a Home Valuation Report for This Property
The Home Valuation Report is an in-depth analysis detailing your home's value as well as a comparison with similar homes in the area
Home Values in the Area
Average Home Value in this Area
Purchase History
| Date | Buyer | Sale Price | Title Company |
|---|---|---|---|
| Furlow Richard | $527,500 | None Available | |
| Armstrong Kenneth H | $650,000 | None Available |
Source: Public Records
Mortgage History
| Date | Status | Borrower | Loan Amount |
|---|---|---|---|
| Open | Furlow Richard | $234,700 | |
| Closed | Furlow Richard | $263,000 | |
| Previous Owner | Armstrong Kenneth H | $417,000 | |
| Previous Owner | Martin Jeffrey B | $506,000 | |
| Previous Owner | Martin Jeffrey B | $100,000 | |
| Previous Owner | Martin Jeffrey B | $496,000 | |
| Previous Owner | Martin Jeffrey B | $54,000 |
Source: Public Records
Tax History Compared to Growth
Tax History
| Year | Tax Paid | Tax Assessment Tax Assessment Total Assessment is a certain percentage of the fair market value that is determined by local assessors to be the total taxable value of land and additions on the property. | Land | Improvement |
|---|---|---|---|---|
| 2024 | $8,155 | $392,894 | $0 | $0 |
| 2023 | $7,781 | $357,900 | $0 | $0 |
| 2022 | $10,598 | $330,000 | $0 | $0 |
| 2021 | $10,295 | $321,300 | $0 | $0 |
| 2020 | $9,862 | $315,700 | $0 | $0 |
| 2019 | $9,606 | $312,900 | $312,900 | $0 |
| 2018 | $9,425 | $280,200 | $0 | $0 |
| 2017 | $8,934 | $282,800 | $0 | $0 |
| 2016 | $6,662 | $233,454 | $0 | $0 |
| 2015 | -- | $232,756 | $0 | $0 |
| 2014 | -- | $225,484 | $0 | $0 |
| 2013 | -- | $225,484 | $0 | $0 |
Source: Public Records
Map
Nearby Homes
- 5002 Quincy Ct
- 2225 Twin Islands Ct
- 4928 Doral Dr Unit 60
- 5449 Countryside Dr
- 5060 Oak Tree Ct Unit 132
- 5077 Village Rd
- 1055 Overlook Ct
- 1054 Overlook Ct
- 5206 Village Rd
- 5583 Creekview Dr
- 3010 Cross Creek Ct Unit 71
- 1718 Bent Pine Ct Unit 37
- 5521 Lohr Lake Dr
- 5915 Creekview Ct
- 2045 Rouse Creek Ct
- 5653 Blue Grass Ct
- 6082 Vineyard Ave
- 2403 Windmill Way
- 0000 Ann Arbor-Saline Rd
- 4536 Lohr Rd