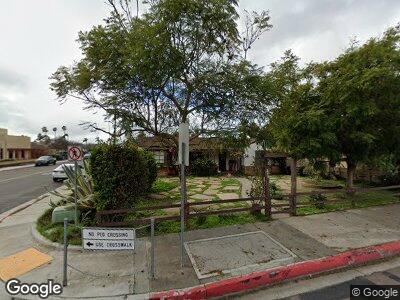
248 4th Ave Chula Vista, CA 91910
Downtown Chula Vista NeighborhoodEstimated Value: $727,000 - $830,000
4
Beds
2
Baths
1,661
Sq Ft
$467/Sq Ft
Est. Value
About This Home
This home is located at 248 4th Ave, Chula Vista, CA 91910 and is currently estimated at $775,531, approximately $466 per square foot. 248 4th Ave is a home located in San Diego County with nearby schools including Vista Square Elementary School, Chula Vista Middle School, and Chula Vista High School.
Ownership History
Date
Name
Owned For
Owner Type
Purchase Details
Closed on
Nov 18, 2024
Sold by
Prober and Raphael Alc
Bought by
Lnv Corporation
Current Estimated Value
Purchase Details
Closed on
Nov 9, 2005
Sold by
Manriquez Maria
Bought by
Manriquez Maria and Manriquez Daniel A
Home Financials for this Owner
Home Financials are based on the most recent Mortgage that was taken out on this home.
Original Mortgage
$432,000
Interest Rate
7.4%
Mortgage Type
Unknown
Purchase Details
Closed on
Mar 24, 2003
Sold by
Manriquez Jose Daniel and Manriquez Maria
Bought by
Manriquez Maria
Home Financials for this Owner
Home Financials are based on the most recent Mortgage that was taken out on this home.
Original Mortgage
$232,000
Interest Rate
6.99%
Mortgage Type
Unknown
Purchase Details
Closed on
Aug 5, 1999
Sold by
Fontes Family Trust 10-13-92
Bought by
Daniel Manriquez Jose and Daniel Maria Manriquez
Create a Home Valuation Report for This Property
The Home Valuation Report is an in-depth analysis detailing your home's value as well as a comparison with similar homes in the area
Home Values in the Area
Average Home Value in this Area
Purchase History
| Date | Buyer | Sale Price | Title Company |
|---|---|---|---|
| Lnv Corporation | $115,944 | None Listed On Document | |
| Manriquez Maria | -- | -- |
Source: Public Records
Mortgage History
| Date | Status | Borrower | Loan Amount |
|---|---|---|---|
| Previous Owner | Manriquez Daniel A | $432,000 | |
| Previous Owner | Manriquez Daniel A | $81,000 | |
| Previous Owner | Manriquez Maria | $420,000 | |
| Previous Owner | Manriquez Maria | $315,000 | |
| Previous Owner | Manriquez Maria | $232,000 |
Source: Public Records
Tax History Compared to Growth
Tax History
| Year | Tax Paid | Tax Assessment Tax Assessment Total Assessment is a certain percentage of the fair market value that is determined by local assessors to be the total taxable value of land and additions on the property. | Land | Improvement |
|---|---|---|---|---|
| 2024 | $5,584 | $324,179 | $97,934 | $226,245 |
| 2023 | $3,689 | $317,823 | $96,014 | $221,809 |
| 2022 | $3,581 | $311,592 | $94,132 | $217,460 |
| 2021 | $3,497 | $305,484 | $92,287 | $213,197 |
| 2020 | $3,413 | $302,352 | $91,341 | $211,011 |
| 2019 | $3,324 | $296,424 | $89,550 | $206,874 |
| 2018 | $3,271 | $290,613 | $87,795 | $202,818 |
| 2017 | $3,201 | $284,916 | $86,074 | $198,842 |
| 2016 | $3,125 | $279,331 | $84,387 | $194,944 |
| 2015 | $3,080 | $275,136 | $83,120 | $192,016 |
| 2014 | $3,027 | $269,747 | $81,492 | $188,255 |
Source: Public Records
Map
Nearby Homes
- 178 Fourth Unit 1
- 149 4th Ave Unit 19
- 151 4th Ave Unit C
- 376 Center St Unit 216
- 376 Center St Unit 304
- 145 4th Ave Unit 11
- 564 Davidson St
- 341 G St
- 569 E St Unit 18
- 535 D St
- 317 Twin Oaks Ave
- 75 Third Ave Unit 22
- 420 Church Ave
- 219 2nd Ave
- 465 4th Ave Unit 17
- 475 4th Ave Unit H
- 471 4th Ave Unit B
- 579 Casselman St
- 593 Casselman St
- 520 Glover Ave