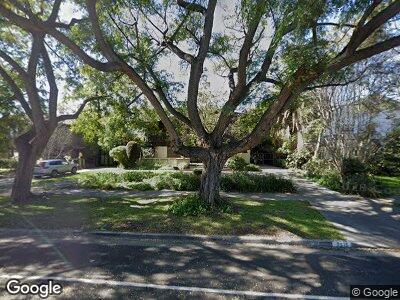
2515 4th Ave Los Angeles, CA 90018
Jefferson Park NeighborhoodEstimated Value: $1,321,000 - $1,467,057
5
Beds
2
Baths
3,733
Sq Ft
$380/Sq Ft
Est. Value
About This Home
This home is located at 2515 4th Ave, Los Angeles, CA 90018 and is currently estimated at $1,418,014, approximately $379 per square foot. 2515 4th Ave is a home located in Los Angeles County with nearby schools including Sixth Avenue Elementary School, Johnnie L. Cochran Jr. Middle School, and Los Angeles Senior High School.
Ownership History
Date
Name
Owned For
Owner Type
Purchase Details
Closed on
Jan 18, 1996
Sold by
Boykin Walter Bernard and Boykin Lorraine
Bought by
Raposa David and Souza Roland
Current Estimated Value
Home Financials for this Owner
Home Financials are based on the most recent Mortgage that was taken out on this home.
Original Mortgage
$100,000
Interest Rate
7.25%
Mortgage Type
Seller Take Back
Create a Home Valuation Report for This Property
The Home Valuation Report is an in-depth analysis detailing your home's value as well as a comparison with similar homes in the area
Home Values in the Area
Average Home Value in this Area
Purchase History
| Date | Buyer | Sale Price | Title Company |
|---|---|---|---|
| Raposa David | $110,000 | Old Republic Title Company |
Source: Public Records
Mortgage History
| Date | Status | Borrower | Loan Amount |
|---|---|---|---|
| Open | Raposa David R | $500,000 | |
| Closed | Raposa David R | $219,000 | |
| Closed | Raposa David | $100,000 |
Source: Public Records
Tax History Compared to Growth
Tax History
| Year | Tax Paid | Tax Assessment Tax Assessment Total Assessment is a certain percentage of the fair market value that is determined by local assessors to be the total taxable value of land and additions on the property. | Land | Improvement |
|---|---|---|---|---|
| 2024 | $3,761 | $283,053 | $169,838 | $113,215 |
| 2023 | $3,697 | $277,504 | $166,508 | $110,996 |
| 2022 | $3,539 | $272,064 | $163,244 | $108,820 |
| 2021 | $3,470 | $266,731 | $160,044 | $106,687 |
| 2019 | $3,371 | $258,822 | $155,298 | $103,524 |
| 2018 | $3,309 | $253,748 | $152,253 | $101,495 |
| 2016 | $3,126 | $243,896 | $146,342 | $97,554 |
| 2015 | $3,082 | $240,233 | $144,144 | $96,089 |
| 2014 | $3,101 | $235,528 | $141,321 | $94,207 |
Source: Public Records
Map
Nearby Homes