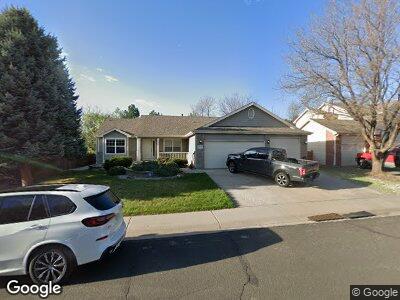
2519 Ridge Creek Rd Fort Collins, CO 80528
Timber Creek NeighborhoodEstimated Value: $615,000 - $681,000
3
Beds
3
Baths
1,741
Sq Ft
$373/Sq Ft
Est. Value
About This Home
This home is located at 2519 Ridge Creek Rd, Fort Collins, CO 80528 and is currently estimated at $650,003, approximately $373 per square foot. 2519 Ridge Creek Rd is a home located in Larimer County with nearby schools including Kruse Elementary School, Preston Middle School, and Fossil Ridge High School.
Ownership History
Date
Name
Owned For
Owner Type
Purchase Details
Closed on
Jun 24, 2004
Sold by
Lowry Christopher J and Lowry Lacy H
Bought by
Eggleston Jeffrey D
Current Estimated Value
Home Financials for this Owner
Home Financials are based on the most recent Mortgage that was taken out on this home.
Original Mortgage
$219,200
Interest Rate
6.32%
Mortgage Type
New Conventional
Purchase Details
Closed on
Sep 17, 1999
Sold by
Westmark Homes Inc
Bought by
Lowry Christopher J and Lowry Lacy J
Home Financials for this Owner
Home Financials are based on the most recent Mortgage that was taken out on this home.
Original Mortgage
$130,000
Interest Rate
7.9%
Purchase Details
Closed on
Dec 30, 1998
Sold by
C & M Homes Inc
Bought by
Westmark Homes Inc
Create a Home Valuation Report for This Property
The Home Valuation Report is an in-depth analysis detailing your home's value as well as a comparison with similar homes in the area
Home Values in the Area
Average Home Value in this Area
Purchase History
| Date | Buyer | Sale Price | Title Company |
|---|---|---|---|
| Eggleston Jeffrey D | $274,000 | North American Title Co | |
| Lowry Christopher J | $215,855 | -- | |
| Westmark Homes Inc | -- | -- | |
| C & M Homes Inc | $85,500 | -- |
Source: Public Records
Mortgage History
| Date | Status | Borrower | Loan Amount |
|---|---|---|---|
| Open | Eggleston Jeffrey D | $166,000 | |
| Closed | Eggleston Jeffrey | $200,510 | |
| Closed | Eggleston Jeffrey D | $219,200 | |
| Previous Owner | Lowry Christopher J | $15,000 | |
| Previous Owner | Lowry Christopher J | $185,000 | |
| Previous Owner | Lowry Christopher J | $131,850 | |
| Previous Owner | Lowry Christopher J | $130,000 | |
| Previous Owner | Westmark Homes Inc | $172,600 |
Source: Public Records
Tax History Compared to Growth
Tax History
| Year | Tax Paid | Tax Assessment Tax Assessment Total Assessment is a certain percentage of the fair market value that is determined by local assessors to be the total taxable value of land and additions on the property. | Land | Improvement |
|---|---|---|---|---|
| 2025 | $3,701 | $44,220 | $4,221 | $39,999 |
| 2024 | $3,701 | $44,220 | $4,221 | $39,999 |
| 2022 | $3,185 | $33,729 | $4,379 | $29,350 |
| 2021 | $3,219 | $34,699 | $4,505 | $30,194 |
| 2020 | $2,984 | $31,890 | $4,505 | $27,385 |
| 2019 | $2,997 | $31,890 | $4,505 | $27,385 |
| 2018 | $2,792 | $30,636 | $4,536 | $26,100 |
| 2017 | $2,783 | $30,636 | $4,536 | $26,100 |
| 2016 | $2,613 | $28,624 | $5,015 | $23,609 |
| 2015 | $2,594 | $28,620 | $5,010 | $23,610 |
| 2014 | $2,360 | $25,870 | $5,010 | $20,860 |
Source: Public Records
Map
Nearby Homes
- 4913 Smallwood Ct
- 2502 Timberwood Dr Unit 91
- 2502 Timberwood Dr Unit 90
- 5115 Fruited Plains Ln
- 5121 Madison Creek Dr
- 2626 Autumn Harvest Way
- 2120 Timber Creek Dr Unit 3
- 5125 Stetson Creek Ct Unit D
- 2224 Stillwater Creek Dr
- 2133 Copper Creek Dr Unit E
- 2231 Stillwater Creek Dr
- 2821 Harvest Park Ln
- 2127 Copper Creek Dr Unit E
- 2821 Amber Waves Ln
- 2925 Indigo Cir N
- 2103 Sweetwater Creek Dr
- 2908 Golden Harvest Ln
- 5225 White Willow Dr Unit N210
- 5225 White Willow Dr Unit J220
- 3027 Rock Creek Dr