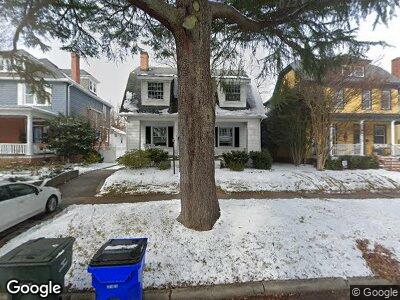
252 E 39th St Norfolk, VA 23504
Colonial Place NeighborhoodEstimated Value: $394,000 - $424,000
3
Beds
2
Baths
2,000
Sq Ft
$205/Sq Ft
Est. Value
About This Home
This home is located at 252 E 39th St, Norfolk, VA 23504 and is currently estimated at $409,871, approximately $204 per square foot. 252 E 39th St is a home located in Norfolk City with nearby schools including Granby Elementary School, Blair Middle School, and Maury High School.
Ownership History
Date
Name
Owned For
Owner Type
Purchase Details
Closed on
Aug 24, 2023
Sold by
Esterson Shawn David
Bought by
Fiorentino Michael Joseph and Lenker Beth Ann
Current Estimated Value
Home Financials for this Owner
Home Financials are based on the most recent Mortgage that was taken out on this home.
Original Mortgage
$319,920
Outstanding Balance
$315,348
Interest Rate
6.78%
Mortgage Type
New Conventional
Estimated Equity
$97,866
Purchase Details
Closed on
Sep 7, 2011
Sold by
Werner Carl N and Werner Virginia T
Bought by
Esterson Shawn David
Home Financials for this Owner
Home Financials are based on the most recent Mortgage that was taken out on this home.
Original Mortgage
$238,500
Interest Rate
4.2%
Mortgage Type
New Conventional
Create a Home Valuation Report for This Property
The Home Valuation Report is an in-depth analysis detailing your home's value as well as a comparison with similar homes in the area
Home Values in the Area
Average Home Value in this Area
Purchase History
| Date | Buyer | Sale Price | Title Company |
|---|---|---|---|
| Fiorentino Michael Joseph | $399,900 | Fidelity National Title | |
| Esterson Shawn David | $265,000 | Priority Title & Escrow |
Source: Public Records
Mortgage History
| Date | Status | Borrower | Loan Amount |
|---|---|---|---|
| Open | Fiorentino Michael Joseph | $319,920 | |
| Previous Owner | Esterson Shawn David | $208,000 | |
| Previous Owner | Esterson Shawn David | $234,000 | |
| Previous Owner | Esterson Shawn David | $238,500 | |
| Previous Owner | Werner Ii Carl Nicholas | $213,000 |
Source: Public Records
Tax History Compared to Growth
Tax History
| Year | Tax Paid | Tax Assessment Tax Assessment Total Assessment is a certain percentage of the fair market value that is determined by local assessors to be the total taxable value of land and additions on the property. | Land | Improvement |
|---|---|---|---|---|
| 2024 | $5,193 | $415,400 | $105,000 | $310,400 |
| 2023 | $4,716 | $342,200 | $105,000 | $237,200 |
| 2022 | $3,903 | $312,200 | $75,000 | $237,200 |
| 2021 | $3,861 | $308,900 | $75,000 | $233,900 |
| 2020 | $3,861 | $308,900 | $75,000 | $233,900 |
| 2019 | $3,668 | $293,400 | $65,500 | $227,900 |
| 2018 | $3,468 | $277,400 | $65,500 | $211,900 |
| 2017 | $3,111 | $270,500 | $65,500 | $205,000 |
| 2016 | $3,002 | $260,700 | $62,000 | $198,700 |
| 2015 | $2,998 | $260,700 | $62,000 | $198,700 |
| 2014 | $2,998 | $260,700 | $62,000 | $198,700 |
Source: Public Records
Map
Nearby Homes
- 115 E 39th St
- 4250 Granby St Unit 208
- 3719 Granby St Unit C-3
- 3719 Granby St Unit C-4
- 1308 Baecher Ln
- 1333 Baecher Ln
- 1320 Windsor Point Rd
- 209 W 38th St
- 426 Delaware Ave Unit 224
- 414 Delaware Ave Unit 222
- 1408 Morris Crescent
- 229 W 37th St
- 3401 Granby St
- 1420 Huntington Crescent
- 402 Carolina Ave
- 404 Carolina Ave
- 429 Maryland Ave
- 412 Carolina Ave
- 410 Carolina Ave
- 209 W 34th St Unit 201