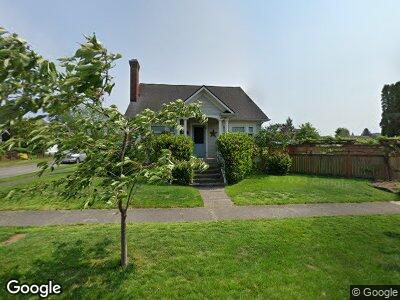
2520 I St Bellingham, WA 98225
Lettered Streets NeighborhoodEstimated Value: $814,000 - $955,268
4
Beds
2
Baths
1,998
Sq Ft
$443/Sq Ft
Est. Value
About This Home
This home is located at 2520 I St, Bellingham, WA 98225 and is currently estimated at $884,817, approximately $442 per square foot. 2520 I St is a home located in Whatcom County with nearby schools including Parkview Elementary School, Whatcom Middle School, and Bellingham High School.
Ownership History
Date
Name
Owned For
Owner Type
Purchase Details
Closed on
Jan 5, 2012
Sold by
Gold William P
Bought by
Rorvig Scott K and Rorvig Stacey L
Current Estimated Value
Home Financials for this Owner
Home Financials are based on the most recent Mortgage that was taken out on this home.
Original Mortgage
$296,000
Interest Rate
3.91%
Mortgage Type
Seller Take Back
Create a Home Valuation Report for This Property
The Home Valuation Report is an in-depth analysis detailing your home's value as well as a comparison with similar homes in the area
Home Values in the Area
Average Home Value in this Area
Purchase History
| Date | Buyer | Sale Price | Title Company |
|---|---|---|---|
| Rorvig Scott K | $371,280 | Stewart Title Company |
Source: Public Records
Mortgage History
| Date | Status | Borrower | Loan Amount |
|---|---|---|---|
| Open | Rorvig Scott K | $245,000 | |
| Closed | Rorvig Scott K | $203,000 | |
| Closed | Rorvig Scott K | $296,000 | |
| Closed | Rorvig Scott K | $296,000 |
Source: Public Records
Tax History Compared to Growth
Tax History
| Year | Tax Paid | Tax Assessment Tax Assessment Total Assessment is a certain percentage of the fair market value that is determined by local assessors to be the total taxable value of land and additions on the property. | Land | Improvement |
|---|---|---|---|---|
| 2024 | $7,038 | $882,202 | $323,274 | $558,928 |
| 2023 | $7,038 | $904,610 | $331,485 | $573,125 |
| 2022 | $5,749 | $779,850 | $285,768 | $494,082 |
| 2021 | $5,640 | $618,929 | $226,800 | $392,129 |
| 2020 | $5,680 | $573,082 | $210,000 | $363,082 |
| 2019 | $5,085 | $557,838 | $183,007 | $374,831 |
| 2018 | $5,121 | $500,729 | $164,307 | $336,422 |
| 2017 | $4,419 | $431,113 | $141,460 | $289,653 |
| 2016 | $3,866 | $388,802 | $126,940 | $261,862 |
| 2015 | $3,790 | $354,079 | $115,940 | $238,139 |
| 2014 | -- | $335,938 | $110,000 | $225,938 |
| 2013 | -- | $348,315 | $94,500 | $253,815 |
Source: Public Records
Map
Nearby Homes