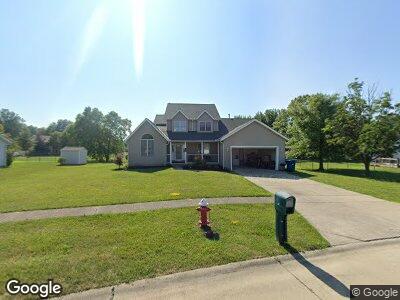
2550 Barkwood Dr Sheffield Village, OH 44054
Estimated Value: $351,000 - $398,000
3
Beds
3
Baths
2,096
Sq Ft
$179/Sq Ft
Est. Value
About This Home
This home is located at 2550 Barkwood Dr, Sheffield Village, OH 44054 and is currently estimated at $374,211, approximately $178 per square foot. 2550 Barkwood Dr is a home located in Lorain County with nearby schools including Knollwood Elementary School, Brookside Intermediate School, and Brookside Middle School.
Ownership History
Date
Name
Owned For
Owner Type
Purchase Details
Closed on
Mar 1, 2015
Sold by
Williams Stephen D
Bought by
Williams Megan A
Current Estimated Value
Home Financials for this Owner
Home Financials are based on the most recent Mortgage that was taken out on this home.
Original Mortgage
$188,500
Interest Rate
4.05%
Mortgage Type
VA
Purchase Details
Closed on
Jun 3, 2005
Sold by
Plummer Clayton D and Plummer Claire A
Bought by
Williams Stephen A and Williams Megan
Home Financials for this Owner
Home Financials are based on the most recent Mortgage that was taken out on this home.
Original Mortgage
$180,000
Interest Rate
5.91%
Mortgage Type
Purchase Money Mortgage
Purchase Details
Closed on
May 10, 2001
Sold by
Federal Enterprises Inc
Bought by
Plummer Clayton D and Plummer Claire A
Purchase Details
Closed on
Nov 13, 1998
Sold by
Flagg Builders Ltd
Bought by
Federal Enterprises Inc
Create a Home Valuation Report for This Property
The Home Valuation Report is an in-depth analysis detailing your home's value as well as a comparison with similar homes in the area
Home Values in the Area
Average Home Value in this Area
Purchase History
| Date | Buyer | Sale Price | Title Company |
|---|---|---|---|
| Williams Megan A | -- | American Patriot Title | |
| Williams Stephen A | -- | Ata Title Agency Ltd | |
| Plummer Clayton D | $190,000 | Midland Title | |
| Federal Enterprises Inc | $38,000 | -- |
Source: Public Records
Mortgage History
| Date | Status | Borrower | Loan Amount |
|---|---|---|---|
| Previous Owner | Williams Megan A | $188,500 | |
| Previous Owner | Williams Stephen A | $180,000 |
Source: Public Records
Tax History Compared to Growth
Tax History
| Year | Tax Paid | Tax Assessment Tax Assessment Total Assessment is a certain percentage of the fair market value that is determined by local assessors to be the total taxable value of land and additions on the property. | Land | Improvement |
|---|---|---|---|---|
| 2024 | $4,377 | $109,575 | $21,777 | $87,798 |
| 2023 | $3,579 | $83,920 | $19,772 | $64,148 |
| 2022 | $3,579 | $83,832 | $19,772 | $64,061 |
| 2021 | $3,603 | $83,832 | $19,772 | $64,061 |
| 2020 | $3,127 | $70,510 | $16,630 | $53,880 |
| 2019 | $3,108 | $70,510 | $16,630 | $53,880 |
| 2018 | $2,500 | $70,510 | $16,630 | $53,880 |
| 2017 | $4,137 | $64,090 | $16,630 | $47,460 |
| 2016 | $4,180 | $64,090 | $16,630 | $47,460 |
| 2015 | $4,169 | $64,090 | $16,630 | $47,460 |
| 2014 | $3,751 | $64,090 | $16,630 | $47,460 |
| 2013 | $3,733 | $64,090 | $16,630 | $47,460 |
Source: Public Records
Map
Nearby Homes
- 5582 Whispering Pines Ln
- 2395 Deerfield Dr
- 38819 Coronado Ave
- 39280 Colorado Ave
- 5430 Hawks Nest Cir
- 2356 Conrad St
- 3133 Grove Ln
- 2760 Fairview Dr
- 5454 Schueller Blvd
- 38629 Fairwood Cir
- 2409 Quail Hollow
- 38000 N Doovys St
- 37592 Bridge Pointe Trail
- 3124 Fairview Dr
- 3617 Weston Dr
- 3644 Denton Dr
- 4547 Day St
- 4281 Berkeley Dr
- 3510 Long Rd
- 1937 Sandalwood Dr Unit 38A