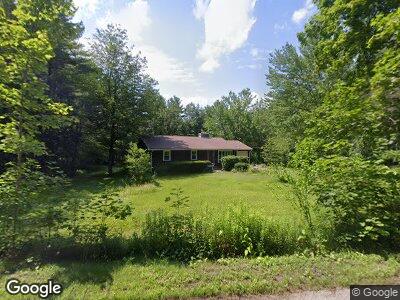
258 Sterling Rd Jefferson, MA 01522
Holden NeighborhoodEstimated Value: $417,000 - $487,000
3
Beds
1
Bath
1,170
Sq Ft
$381/Sq Ft
Est. Value
About This Home
This home is located at 258 Sterling Rd, Jefferson, MA 01522 and is currently estimated at $445,363, approximately $380 per square foot. 258 Sterling Rd is a home located in Worcester County with nearby schools including Wachusett Regional High School.
Ownership History
Date
Name
Owned For
Owner Type
Purchase Details
Closed on
Oct 17, 2024
Sold by
Haynes Loretta A
Bought by
Loretta A Haynes Irt and Cherrier
Current Estimated Value
Create a Home Valuation Report for This Property
The Home Valuation Report is an in-depth analysis detailing your home's value as well as a comparison with similar homes in the area
Home Values in the Area
Average Home Value in this Area
Purchase History
| Date | Buyer | Sale Price | Title Company |
|---|---|---|---|
| Loretta A Haynes Irt | -- | None Available | |
| Loretta A Haynes Irt | -- | None Available |
Source: Public Records
Tax History Compared to Growth
Tax History
| Year | Tax Paid | Tax Assessment Tax Assessment Total Assessment is a certain percentage of the fair market value that is determined by local assessors to be the total taxable value of land and additions on the property. | Land | Improvement |
|---|---|---|---|---|
| 2025 | $5,514 | $397,800 | $164,200 | $233,600 |
| 2024 | $5,127 | $362,300 | $159,300 | $203,000 |
| 2023 | $4,936 | $329,300 | $138,600 | $190,700 |
| 2022 | $4,748 | $286,700 | $108,400 | $178,300 |
| 2021 | $4,595 | $264,100 | $103,100 | $161,000 |
| 2020 | $4,291 | $252,400 | $98,200 | $154,200 |
| 2019 | $4,232 | $242,500 | $98,200 | $144,300 |
| 2018 | $3,938 | $223,600 | $93,600 | $130,000 |
| 2017 | $3,699 | $210,300 | $93,600 | $116,700 |
| 2016 | $3,469 | $201,100 | $89,000 | $112,100 |
Source: Public Records
Map
Nearby Homes
- 0 North St
- 85 North St
- 650 Manning St
- 125 Moscow Rd
- 92 Redemption Rock Trail
- 67 Moscow Rd
- 291 Laurel St
- 6 Elmwood Ave
- 136 Hosmer St Unit 136B
- 1 General Hobbs Rd Unit 2
- 1202 Wachusett St
- 299 Redemption Rock Trail S
- 96 Ball Hill Rd
- 0 Boutelle Rd
- 929 Wachusett St
- 90 Houghton Rd
- 73 Worcester Rd Unit A
- 58 Deanna Dr
- 65 Deanna Dr
- 16 Pine Arden Dr