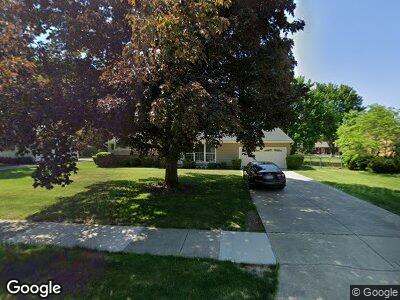
25889 Yeoman Dr Westlake, OH 44145
Estimated Value: $283,000 - $348,000
4
Beds
2
Baths
1,765
Sq Ft
$177/Sq Ft
Est. Value
About This Home
This home is located at 25889 Yeoman Dr, Westlake, OH 44145 and is currently estimated at $312,195, approximately $176 per square foot. 25889 Yeoman Dr is a home located in Cuyahoga County with nearby schools including Dover Intermediate School, Lee Burneson Middle School, and Westlake High School.
Ownership History
Date
Name
Owned For
Owner Type
Purchase Details
Closed on
Nov 10, 2023
Sold by
Kelly Helen Marie
Bought by
Spring Thomas P
Current Estimated Value
Purchase Details
Closed on
Mar 11, 2021
Sold by
Available Name Not
Bought by
Spring Helen M and Kelly Helen M
Home Financials for this Owner
Home Financials are based on the most recent Mortgage that was taken out on this home.
Original Mortgage
$50,389
Interest Rate
3.1%
Mortgage Type
Future Advance Clause Open End Mortgage
Purchase Details
Closed on
Sep 12, 2020
Sold by
Spring Helen M and Kelly Helen M
Bought by
Hebb Kelly Ann
Purchase Details
Closed on
Feb 20, 2009
Sold by
Kelly Helen Marie
Bought by
Kelly Helen Marie
Purchase Details
Closed on
Feb 16, 1988
Sold by
Spring Helen M
Bought by
Kelly Helen M
Purchase Details
Closed on
Sep 23, 1986
Sold by
Spring Thomas R
Bought by
Spring Helen M
Purchase Details
Closed on
Jun 10, 1977
Sold by
Bannan James J and Bannan Evelyn M
Bought by
Spring Thomas R
Purchase Details
Closed on
Jan 1, 1975
Bought by
Bannan James J and Bannan Evelyn M
Create a Home Valuation Report for This Property
The Home Valuation Report is an in-depth analysis detailing your home's value as well as a comparison with similar homes in the area
Home Values in the Area
Average Home Value in this Area
Purchase History
| Date | Buyer | Sale Price | Title Company |
|---|---|---|---|
| Kelly Helen Marie | -- | None Available | |
| Kelly Helen M | -- | -- | |
| Spring Helen M | $15,900 | -- | |
| Spring Thomas R | $64,000 | -- | |
| Bannan James J | -- | -- |
Source: Public Records
Mortgage History
| Date | Status | Borrower | Loan Amount |
|---|---|---|---|
| Previous Owner | Kelly Helen Marie | $50,389 | |
| Previous Owner | Kelly Helen Marie | $99,850 | |
| Previous Owner | The Kelly Family Trust | $14,207 |
Source: Public Records
Tax History Compared to Growth
Tax History
| Year | Tax Paid | Tax Assessment Tax Assessment Total Assessment is a certain percentage of the fair market value that is determined by local assessors to be the total taxable value of land and additions on the property. | Land | Improvement |
|---|---|---|---|---|
| 2024 | $3,927 | $90,580 | $17,710 | $72,870 |
| 2023 | $3,741 | $74,870 | $17,290 | $57,580 |
| 2022 | $3,605 | $74,865 | $17,290 | $57,575 |
| 2021 | $3,610 | $74,870 | $17,290 | $57,580 |
| 2020 | $3,287 | $63,980 | $14,770 | $49,210 |
| 2019 | $3,187 | $182,800 | $42,200 | $140,600 |
| 2018 | $3,201 | $63,980 | $14,770 | $49,210 |
| 2017 | $3,057 | $58,350 | $11,550 | $46,800 |
| 2016 | $3,040 | $58,350 | $11,550 | $46,800 |
| 2015 | $2,990 | $58,350 | $11,550 | $46,800 |
| 2014 | $2,990 | $56,630 | $11,200 | $45,430 |
Source: Public Records
Map
Nearby Homes
- 25767 Melibee Dr
- 25715 Yeoman Dr
- 25726 Laura Ln
- 2890 Margaretta Dr
- 25360 Hall Dr
- 25657 Rose Rd
- 25832 Iris Ct
- 28276 Hallberg Dr
- 28282 Hallberg Dr
- 28264 Hallberg Dr
- 2375 W Hedgewood Dr
- 3181 Dover Center Rd
- 3843 Willow Run
- 3700 Greenbriar Cir
- 25070 Doe Dr
- 27441 Westown Blvd
- 3101 Macintosh Dr Unit 301
- 24861 Antler Dr
- 2820 N Bay Dr Unit P16
- 2009 Columbia Rd