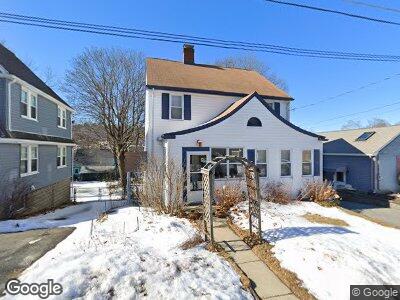
26 S Mountain Ave Melrose, MA 02176
Oak Grove-Pine Banks NeighborhoodEstimated Value: $746,000 - $795,000
3
Beds
1
Bath
1,666
Sq Ft
$463/Sq Ft
Est. Value
About This Home
This home is located at 26 S Mountain Ave, Melrose, MA 02176 and is currently estimated at $772,058, approximately $463 per square foot. 26 S Mountain Ave is a home located in Middlesex County with nearby schools including Hoover Elementary School, Lincoln Elementary School, and Winthrop Elementary School.
Ownership History
Date
Name
Owned For
Owner Type
Purchase Details
Closed on
Mar 13, 2017
Sold by
Hainsworth Clayton and Holzman Alyssa
Bought by
Hainsworth Clayton
Current Estimated Value
Purchase Details
Closed on
Jun 25, 2010
Sold by
Daniels Eric J and Daniels Kathleen A
Bought by
Hainsworth Clayton and Holzman Alyssa
Home Financials for this Owner
Home Financials are based on the most recent Mortgage that was taken out on this home.
Original Mortgage
$342,000
Interest Rate
4.98%
Mortgage Type
Purchase Money Mortgage
Purchase Details
Closed on
Aug 26, 2008
Sold by
Anderson Maureen A and Anderson Richard J
Bought by
Daniels A Kathleen and Daniels Eric J
Home Financials for this Owner
Home Financials are based on the most recent Mortgage that was taken out on this home.
Original Mortgage
$306,000
Interest Rate
6.4%
Mortgage Type
Purchase Money Mortgage
Create a Home Valuation Report for This Property
The Home Valuation Report is an in-depth analysis detailing your home's value as well as a comparison with similar homes in the area
Home Values in the Area
Average Home Value in this Area
Purchase History
| Date | Buyer | Sale Price | Title Company |
|---|---|---|---|
| Hainsworth Clayton | -- | -- | |
| Hainsworth Clayton | $360,000 | -- | |
| Daniels A Kathleen | $340,000 | -- |
Source: Public Records
Mortgage History
| Date | Status | Borrower | Loan Amount |
|---|---|---|---|
| Open | Hainsworth Clayton | $372,500 | |
| Previous Owner | Hainsworth Clayton | $342,000 | |
| Previous Owner | Daniels A Kathleen | $306,000 | |
| Previous Owner | Anderson Richard J | $65,000 | |
| Previous Owner | Anderson Richard J | $27,000 | |
| Previous Owner | Anderson Richard J | $21,000 |
Source: Public Records
Tax History Compared to Growth
Tax History
| Year | Tax Paid | Tax Assessment Tax Assessment Total Assessment is a certain percentage of the fair market value that is determined by local assessors to be the total taxable value of land and additions on the property. | Land | Improvement |
|---|---|---|---|---|
| 2025 | $70 | $710,000 | $420,200 | $289,800 |
| 2024 | $6,781 | $682,900 | $393,100 | $289,800 |
| 2023 | $6,572 | $630,700 | $366,000 | $264,700 |
| 2022 | $6,414 | $606,800 | $352,400 | $254,400 |
| 2021 | $6,366 | $581,400 | $338,800 | $242,600 |
| 2020 | $6,126 | $554,400 | $311,700 | $242,700 |
| 2019 | $5,626 | $520,400 | $298,200 | $222,200 |
| 2018 | $5,321 | $469,600 | $247,400 | $222,200 |
| 2017 | $5,220 | $442,400 | $237,200 | $205,200 |
| 2016 | $4,931 | $399,900 | $210,100 | $189,800 |
| 2015 | $4,785 | $369,200 | $210,100 | $159,100 |
| 2014 | $4,677 | $352,200 | $193,100 | $159,100 |
Source: Public Records
Map
Nearby Homes
- 17 Forest St
- 29 Temple St
- 60 Willard St
- 51 1/2 Willard St
- 205 Columbia St
- 65 Beacon St
- 32 Willard St
- 2 Rocky Nook Unit 2
- 171 Kimball St
- 3 Goodwin Ave
- 16 Hillside Park
- 7 Berkeley St
- 16 Berkeley St
- 71 Orchard St
- 3 Lebanon Terrace Unit 1
- 287 Swains Pond Ave
- 48 Rockwell St
- 142 Granite St
- 2 Granite St
- 8 Glen Ave