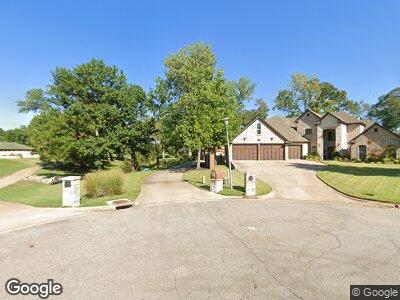
2604 Carrington Pointe Rd Fort Smith, AR 72903
Estimated Value: $436,000 - $630,000
4
Beds
3
Baths
4,054
Sq Ft
$136/Sq Ft
Est. Value
About This Home
This home is located at 2604 Carrington Pointe Rd, Fort Smith, AR 72903 and is currently estimated at $550,437, approximately $135 per square foot. 2604 Carrington Pointe Rd is a home located in Sebastian County with nearby schools including John P. Woods Elementary School, L.A. Chaffin Junior High School, and Southside High School.
Ownership History
Date
Name
Owned For
Owner Type
Purchase Details
Closed on
Feb 27, 2020
Sold by
Ocker Ronald W and Ocker Jan B
Bought by
Ocker Ronald W and Ocker Jan B
Current Estimated Value
Purchase Details
Closed on
Oct 1, 2014
Sold by
Ocker Ronald W
Bought by
The Ocker Family Trust
Purchase Details
Closed on
Sep 27, 2010
Sold by
Branson Cleve D
Bought by
Ocker Ii Ronald W and Ocker Janet B
Home Financials for this Owner
Home Financials are based on the most recent Mortgage that was taken out on this home.
Original Mortgage
$375,000
Interest Rate
4.46%
Mortgage Type
New Conventional
Purchase Details
Closed on
Jun 21, 1999
Bought by
Davis Timothy R and Karen Allen
Purchase Details
Closed on
Dec 4, 1996
Bought by
Wilson Beverly M
Purchase Details
Closed on
Oct 3, 1995
Bought by
Erc Properties Inc
Create a Home Valuation Report for This Property
The Home Valuation Report is an in-depth analysis detailing your home's value as well as a comparison with similar homes in the area
Home Values in the Area
Average Home Value in this Area
Purchase History
| Date | Buyer | Sale Price | Title Company |
|---|---|---|---|
| Ocker Ronald W | -- | None Available | |
| The Ocker Family Trust | -- | None Available | |
| Ocker Ii Ronald W | $515,000 | Mosley Abstract & Title Insu | |
| Davis Timothy R | $65,000 | -- | |
| Wilson Beverly M | $60,000 | -- | |
| Erc Properties Inc | -- | -- |
Source: Public Records
Mortgage History
| Date | Status | Borrower | Loan Amount |
|---|---|---|---|
| Open | Ocker Ronald W | $385,000 | |
| Closed | Ocker Ii Ronald W | $375,000 | |
| Previous Owner | Branson Cleve D | $200,000 |
Source: Public Records
Tax History Compared to Growth
Tax History
| Year | Tax Paid | Tax Assessment Tax Assessment Total Assessment is a certain percentage of the fair market value that is determined by local assessors to be the total taxable value of land and additions on the property. | Land | Improvement |
|---|---|---|---|---|
| 2024 | $4,549 | $86,650 | $30,000 | $56,650 |
| 2023 | $4,606 | $86,650 | $30,000 | $56,650 |
| 2022 | $4,656 | $86,650 | $30,000 | $56,650 |
| 2021 | $4,656 | $86,650 | $30,000 | $56,650 |
| 2020 | $3,012 | $58,330 | $30,000 | $28,330 |
| 2019 | $3,066 | $88,750 | $30,000 | $58,750 |
| 2018 | $4,803 | $88,750 | $30,000 | $58,750 |
| 2017 | $4,309 | $88,750 | $30,000 | $58,750 |
| 2016 | $4,577 | $88,750 | $30,000 | $58,750 |
| 2015 | $4,227 | $88,750 | $30,000 | $58,750 |
| 2014 | $3,970 | $82,280 | $20,000 | $62,280 |
Source: Public Records
Map
Nearby Homes
- 2407 Wyndermere Way
- 2411 Wyndermere Way
- TBD Wyndermere Way
- Lot 2 Wyndermere Way
- Lot 6 Wyndermere Way
- 9008 Copper Oaks Ln
- 3012 S 96th St
- 3001 Brighton Point
- 9005 Lakeside Way
- 8905 Copper Oaks Ln
- 8815 Lakeside Way
- 3208 S 93rd Cir
- 3213 S 92nd St
- 3300 S 97th St
- 2409 S 87th Dr
- 2401 S 87th Dr
- TBD Cobble Hill Ln
- 2000 Cobble Hill Ln
- 2801 Brighton Ct
- 9313 Houston St